NetFlix 2004 Annual Report Download - page 38
Download and view the complete annual report
Please find page 38 of the 2004 NetFlix annual report below. You can navigate through the pages in the report by either clicking on the pages listed below, or by using the keyword search tool below to find specific information within the annual report.-
 1
1 -
2
-
3
-
4
-
5
-
6
-
7
-
8
-
9
-
10
-
11
-
12
-
13
-
14
-
15
-
16
-
17
-
18
-
19
-
20
-
21
-
22
-
23
-
24
-
25
-
26
-
27
-
 28
28 -
 29
29 -
 30
30 -
 31
31 -
 32
32 -
 33
33 -
 34
34 -
 35
35 -
 36
36 -
 37
37 -
 38
38 -
 39
39 -
 40
40 -
 41
41 -
 42
42 -
 43
43 -
 44
44 -
 45
45 -
 46
46 -
 47
47 -
 48
48 -
49
-
50
-
51
-
52
-
53
-
54
-
55
-
56
-
57
-
58
-
59
-
60
-
61
-
62
-
63
-
64
-
65
-
66
-
67
-
68
-
69
-
70
-
71
-
72
-
73
-
74
-
75
-
76
-
77
-
78
-
79
-
80
-
81
-
82
-
83
-
84
-
85
-
86
-
87
-
88
-
89
-
90
-
91
-
92
-
93
-
94
-
95
 |
 |

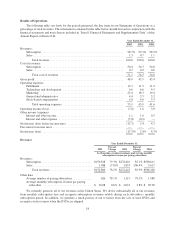
development expenses decreased primarily due to a greater increase in revenues than technology and
development expenses.
The increase in technology and development expenses in absolute dollars from 2002 to 2003 was primarily
the result of an increase in personnel-related costs, partially offset by a modest decrease in the depreciation of
computer hardware and capitalized software. As a percentage of revenues, technology and development expenses
decreased primarily due to a greater increase in revenues than technology and development expenses.
We continuously research and test a variety of potential improvements to our internal hardware and
software systems in an effort to improve our productivity and enhance our subscribers’ experience. Additionally,
we are developing solutions for downloading movies to subscribers. As a result, we expect our technology and
development expenses will continue to increase in absolute dollars in 2005.
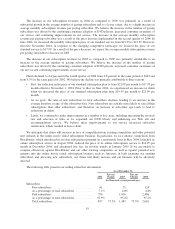
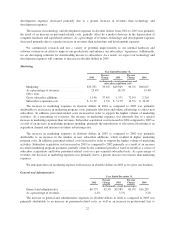
Marketing
Year Ended December 31,
2002
Percent
Change 2003
Percent
Change 2004
(in thousands, except percentages and
subscriber acquisition cost)
Marketing ............................. $35,783 39.6% $49,949 96.3% $98,027
As a percentage of revenues ............... 23.4% 18.3% 19.4%
Other data:
Gross subscriber additions ................ 1,140 37.8% 1,571 72.9% 2,716
Subscriber acquisition cost ................ $ 31.39 1.3% $ 31.79 13.5% $ 36.09
The increase in marketing expenses in absolute dollars in 2004 as compared to 2003 was primarily
attributable to an increase in marketing program costs, primarily television and online advertising, to attract new
subscribers. In addition, personnel-related costs increased in order to support the higher volume of marketing
activities. As a percentage of revenues, the increase in marketing expenses was primarily due to a greater
increase in marketing expenses than revenues. Subscriber acquisition cost increased in 2004 compared to 2003 as
a result of an increase in marketing program spending, primarily the introduction of television advertising as an
acquisition channel and increases in online advertising rates.
The increase in marketing expenses in absolute dollars in 2003 as compared to 2002 was primarily
attributable to an increase in the number of new subscriber additions, which resulted in higher marketing
program costs. In addition, personnel-related costs increased in order to support the higher volume of marketing
activities. Subscriber acquisition cost increased in 2003 as compared to 2002 primarily as a result of an increase
in certain marketing program payments, partially offset by the continued growth of word-of-mouth as a source of
subscriber acquisitions and lower personnel-related costs on a per-acquired subscriber basis. As a percentage of
revenues, the decrease in marketing expenses was primarily due to a greater increase in revenues than marketing
expenses.
We anticipate that our marketing expense will increase in absolute dollars in 2005 as we grow our business.
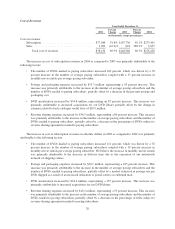
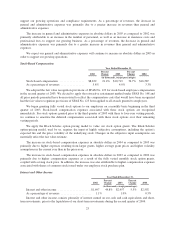
General and Administrative
Year Ended December 31,
2002
Percent
Change 2003
Percent
Change 2004
(in thousands, except percentages)
General and administrative .................. $6,737 42.3% $9,585 69.9% $16,287
As a percentage of revenues ................. 4.4% 3.5% 3.2%
The increase in general and administrative expenses in absolute dollars in 2004 as compared to 2003 was
primarily attributable to an increase in personnel-related costs, as well as an increase in professional fees to
22