NetFlix 2004 Annual Report Download - page 27
Download and view the complete annual report
Please find page 27 of the 2004 NetFlix annual report below. You can navigate through the pages in the report by either clicking on the pages listed below, or by using the keyword search tool below to find specific information within the annual report.-
 1
1 -
2
-
3
-
4
-
5
-
6
-
7
-
8
-
9
-
10
-
11
-
12
-
13
-
14
-
15
-
16
-
 17
17 -
 18
18 -
 19
19 -
 20
20 -
 21
21 -
 22
22 -
 23
23 -
 24
24 -
 25
25 -
 26
26 -
 27
27 -
 28
28 -
 29
29 -
 30
30 -
 31
31 -
 32
32 -
 33
33 -
 34
34 -
 35
35 -
 36
36 -
 37
37 -
38
-
39
-
40
-
41
-
42
-
43
-
44
-
45
-
46
-
47
-
48
-
49
-
50
-
51
-
52
-
53
-
54
-
55
-
56
-
57
-
58
-
59
-
60
-
61
-
62
-
63
-
64
-
65
-
66
-
67
-
68
-
69
-
70
-
71
-
72
-
73
-
74
-
75
-
76
-
77
-
78
-
79
-
80
-
81
-
82
-
83
-
84
-
85
-
86
-
87
-
88
-
89
-
90
-
91
-
92
-
93
-
94
-
95
 |
 |

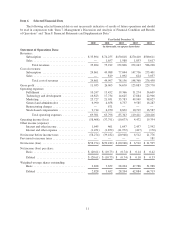
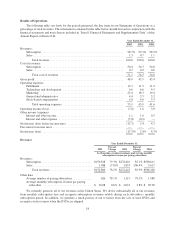
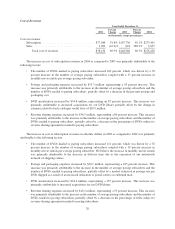
Item 6. Selected Financial Data
The following selected financial data is not necessarily indicative of results of future operations and should
be read in conjunction with “Item 7. Management’s Discussion and Analysis of Financial Condition and Results
of Operations” and “Item 8. Financial Statements and Supplementary Data.”
Year Ended December 31,
2000 2001 2002 2003 2004
(in thousands, except per share data)
Statement of Operations Data:
Revenues:
Subscription ............................. $35,894 $74,255 $150,818 $270,410 $500,611
Sales ................................... — 1,657 1,988 1,833 5,617
Totalrevenues ....................... 35,894 75,912 152,806 272,243 506,228
Cost of revenues:
Subscription ............................. 24,861 49,088 77,044 147,736 273,401
Sales ................................... — 819 1,092 624 3,057
Totalcostofrevenues ................. 24,861 49,907 78,136 148,360 276,458
Grossprofit.................................. 11,033 26,005 74,670 123,883 229,770
Operating expenses:
Fulfillment .............................. 10,247 13,452 19,366 31,274 56,609
Technology and development ............... 16,823 17,734 14,625 17,884 22,906
Marketing ............................... 25,727 21,031 35,783 49,949 98,027
General and administrative ................. 6,990 4,658 6,737 9,585 16,287
Restructuring charges ...................... — 671 — — —
Stock-based compensation .................. 9,714 6,250 8,832 10,719 16,587
Total operating expenses ............... 69,501 63,796 85,343 119,411 210,416
Operating income (loss) ........................ (58,468) (37,791) (10,673) 4,472 19,354
Other income (expense):
Interest and other income ................... 1,645 461 1,697 2,457 2,592
Interest and other expense .................. (1,451) (1,852) (11,972) (417) (170)
Netincomebeforeincometaxes ................. (58,274) (39,182) (20,948) 6,512 21,776
Provision for income taxes ...................... — — — — 181
Netincome(loss) ............................. $(58,274) $(39,182) $ (20,948) $ 6,512 $ 21,595
Net income (loss) per share:
Basic ................................... $ (20.61) $ (10.73) $ (0.74) $ 0.14 $ 0.42
Diluted ................................. $ (20.61) $ (10.73) $ (0.74) $ 0.10 $ 0.33
Weighted-average shares outstanding:
Basic ................................... 2,828 3,652 28,204 47,786 51,988
Diluted ................................. 2,828 3,652 28,204 62,884 64,713
11