NetFlix 2004 Annual Report Download - page 41
Download and view the complete annual report
Please find page 41 of the 2004 NetFlix annual report below. You can navigate through the pages in the report by either clicking on the pages listed below, or by using the keyword search tool below to find specific information within the annual report.-
 1
1 -
2
-
3
-
4
-
5
-
6
-
7
-
8
-
9
-
10
-
11
-
12
-
13
-
14
-
15
-
16
-
17
-
18
-
19
-
20
-
21
-
22
-
23
-
24
-
25
-
26
-
27
-
28
-
29
-
30
-
 31
31 -
 32
32 -
 33
33 -
 34
34 -
 35
35 -
 36
36 -
 37
37 -
 38
38 -
 39
39 -
 40
40 -
 41
41 -
 42
42 -
 43
43 -
 44
44 -
 45
45 -
 46
46 -
 47
47 -
 48
48 -
 49
49 -
 50
50 -
 51
51 -
52
-
53
-
54
-
55
-
56
-
57
-
58
-
59
-
60
-
61
-
62
-
63
-
64
-
65
-
66
-
67
-
68
-
69
-
70
-
71
-
72
-
73
-
74
-
75
-
76
-
77
-
78
-
79
-
80
-
81
-
82
-
83
-
84
-
85
-
86
-
87
-
88
-
89
-
90
-
91
-
92
-
93
-
94
-
95
 |
 |

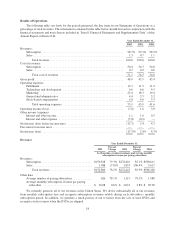
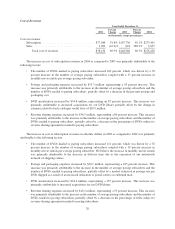
Operating activities: Net cash provided by operating activities increased by $57.8 million in 2004 as
compared to 2003. The increase was primarily attributable to an increase in net income adjusted for an increase
in non-cash amortization of our DVD library as a result of increased purchases of titles, an increase in stock-
based compensation expense and an increase in deferred revenue due to a larger subscriber base.
The increase in net cash provided by operating activities in 2003 as compared to 2002 was primarily
attributable to net income generated in 2003 as compared to a net loss incurred in 2002, adjusted for an increase
in the amortization of our DVD library as a result of increased purchases of titles during 2003, an increase in
accounts payable as a result of our growing operations, an increase in deferred revenue due to a larger subscriber
base and an increase in stock-based compensation expenses. This increase in net cash was partially offset by the
decrease in non-cash interest expense in 2003. Non-cash interest expense included a one-time charge of $10.7
million related to an early debt repayment in 2002.
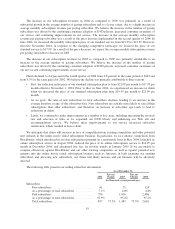
Investing activities: Net cash used in investing activities increased slightly in 2004 as compared to 2003.
The increase was primarily attributable to increased purchases of titles for our DVD library to support our larger
subscriber base and increased purchases of property and equipment to support our growing operations in 2004 as
compared to 2003. However, the increase was partially offset by net proceeds of $45.0 million from the sale of
our short-term investments.
The decrease in net cash used in investing activities in 2003 as compared to 2002 was primarily attributable
to substantially smaller purchases of short-term investments in 2003. Purchases of short-term investments were
significantly higher in 2002 as a result of the proceeds from our initial public offering in May 2002. This
decrease in net cash was partially offset by an increase in both the purchases of property and equipment to
support our growing business, and the acquisitions of DVD titles for our library to support our larger subscriber
base in 2003.
Financing activities: Net cash provided by financing activities increased slightly in 2004 as compared to
2003. The increase was primarily attributable to a decrease in the repayment of debt and other obligations offset
partially by lower proceeds from issuance of common stock under our employee stock plans.
The decrease in net cash provided by financing activities in 2003 as compared to 2002 was primarily
attributable to substantially smaller proceeds from the issuance of common stock in 2003. Proceeds from the
issuance of common stock were significantly higher in 2002 as a result of our initial public offering. This
decrease was partially offset by a decrease in the repayment of debt and other obligations in 2003.
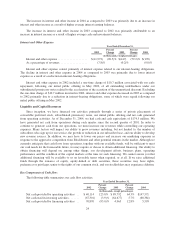
Contractual Obligations
The following table summarizes our contractual obligations at December 31, 2004 (in thousands):
Payments due by period
Contractual Obligations: Total
Less than
1year 1–3 years 3–5 years
More than
5 years
Capital lease obligations ............................ $ 80 $ 80 $ — $ — $ —
Operating lease obligations .......................... 29,291 5,946 10,710 6,234 6,401
Capital purchase obligations (1) ...................... 13,220 7,220 4,000 2,000 —
Otherpurchaseobligations(2) ....................... 8,677 8,677 — — —
Total ....................................... $51,268 $21,923 $14,710 $8,234 $6,401
(1) Capital purchase obligations include commitments for construction or purchase of property, plant and
equipment. They were not recorded as liabilities on our balance sheet as of December 31, 2004, as we had
not yet received the related goods or taken title to the property.
(2) Other purchase obligations relate to acquisitions for our DVD library. Our purchase orders are based on our
current needs and are generally fulfilled by our vendors within short time horizons.
25