NetFlix 2004 Annual Report Download - page 34
Download and view the complete annual report
Please find page 34 of the 2004 NetFlix annual report below. You can navigate through the pages in the report by either clicking on the pages listed below, or by using the keyword search tool below to find specific information within the annual report.-
 1
1 -
2
-
3
-
4
-
5
-
6
-
7
-
8
-
9
-
10
-
11
-
12
-
13
-
14
-
15
-
16
-
17
-
18
-
19
-
20
-
21
-
22
-
23
-
 24
24 -
 25
25 -
 26
26 -
 27
27 -
 28
28 -
 29
29 -
 30
30 -
 31
31 -
 32
32 -
 33
33 -
 34
34 -
 35
35 -
 36
36 -
 37
37 -
 38
38 -
 39
39 -
 40
40 -
 41
41 -
 42
42 -
 43
43 -
 44
44 -
45
-
46
-
47
-
48
-
49
-
50
-
51
-
52
-
53
-
54
-
55
-
56
-
57
-
58
-
59
-
60
-
61
-
62
-
63
-
64
-
65
-
66
-
67
-
68
-
69
-
70
-
71
-
72
-
73
-
74
-
75
-
76
-
77
-
78
-
79
-
80
-
81
-
82
-
83
-
84
-
85
-
86
-
87
-
88
-
89
-
90
-
91
-
92
-
93
-
94
-
95
 |
 |

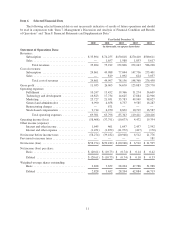
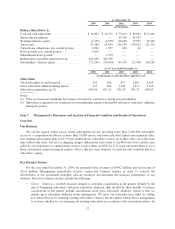
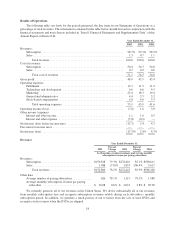
Results of Operations
The following table sets forth, for the periods presented, the line items in our Statements of Operations as a
percentage of total revenues. The information contained in the table below should be read in conjunction with the
financial statements and notes thereto included in “Item 8. Financial Statements and Supplementary Data” of this
Annual Report on Form 10-K.
Year Ended December 31,
2002 2003 2004
Revenues:
Subscription ....................................................... 98.7% 99.3% 98.9%
Sales ............................................................. 1.3 0.7 1.1
Totalrevenues ................................................. 100.0 100.0 100.0
Cost of revenues:
Subscription ....................................................... 50.4 54.3 54.0
Sales ............................................................. 0.7 0.2 0.6
Totalcostofrevenues ........................................... 51.1 54.5 54.6
Grossprofit............................................................ 48.9 45.5 45.4
Operating expenses:
Fulfillment ........................................................ 12.7 11.5 11.2
Technology and development ......................................... 9.6 6.6 4.5
Marketing ......................................................... 23.4 18.3 19.4
General and administrative ........................................... 4.4 3.5 3.2
Stock-based compensation ............................................ 5.8 4.0 3.3
Total operating expenses ......................................... 55.9 43.9 41.6
Operating income (loss) .................................................. (7.0) 1.6 3.8
Other income (expense):
Interest and other income ............................................. 1.1 1.0 0.5
Interest and other expense ............................................ (7.8) (0.2) —
Netincome(loss)beforeincometaxes ...................................... (13.7) 2.4 4.3
Provision for income taxes ................................................ — — —
Netincome(loss) ....................................................... (13.7)% 2.4% 4.3%
Revenues
Year Ended December 31,
2002
Percent
Change 2003
Percent
Change 2004
(in thousands, except percentages and average monthly
subscription revenue per paying subscriber)
Revenues:
Subscription .................................. $150,818 79.3% $270,410 85.1% $500,611
Sales ....................................... 1,988 (7.8)% 1,833 206.4% 5,617
Totalrevenues ............................ $152,806 78.2% $272,243 85.9% $506,228
Other data:
Average number of paying subscribers ............. 626 78.1% 1,115 78.3% 1,988
Average monthly subscription revenue per paying
subscriber ................................. $ 20.08 0.6% $ 20.21 3.8%$ 20.98
We currently generate all of our revenues in the United States. We derive substantially all of our revenues
from monthly subscription fees and recognize subscription revenues ratably during each subscriber’s monthly
subscription period. In addition, we generate a small portion of our revenues from the sale of used DVDs and
recognize such revenues when the DVDs are shipped.
18