NetFlix 2004 Annual Report Download - page 39
Download and view the complete annual report
Please find page 39 of the 2004 NetFlix annual report below. You can navigate through the pages in the report by either clicking on the pages listed below, or by using the keyword search tool below to find specific information within the annual report.-
 1
1 -
2
-
3
-
4
-
5
-
6
-
7
-
8
-
9
-
10
-
11
-
12
-
13
-
14
-
15
-
16
-
17
-
18
-
19
-
20
-
21
-
22
-
23
-
24
-
25
-
26
-
27
-
28
-
 29
29 -
 30
30 -
 31
31 -
 32
32 -
 33
33 -
 34
34 -
 35
35 -
 36
36 -
 37
37 -
 38
38 -
 39
39 -
 40
40 -
 41
41 -
 42
42 -
 43
43 -
 44
44 -
 45
45 -
 46
46 -
 47
47 -
 48
48 -
 49
49 -
50
-
51
-
52
-
53
-
54
-
55
-
56
-
57
-
58
-
59
-
60
-
61
-
62
-
63
-
64
-
65
-
66
-
67
-
68
-
69
-
70
-
71
-
72
-
73
-
74
-
75
-
76
-
77
-
78
-
79
-
80
-
81
-
82
-
83
-
84
-
85
-
86
-
87
-
88
-
89
-
90
-
91
-
92
-
93
-
94
-
95
 |
 |

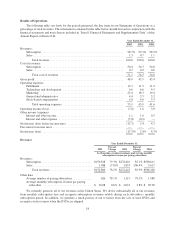
support our growing operations and compliance requirements. As a percentage of revenues, the decrease in
general and administrative expenses was primarily due to a greater increase in revenues than general and
administrative expenses.
The increase in general and administrative expenses in absolute dollars in 2003 as compared to 2002 was
primarily attributable to an increase in the number of personnel, as well as an increase in insurance costs and
professional fees, to support our growing business. As a percentage of revenues, the decrease in general and
administrative expenses was primarily due to a greater increase in revenues than general and administrative
expenses.
We expect our general and administrative expenses will continue to increase in absolute dollars in 2005 in
order to support our growing operations.
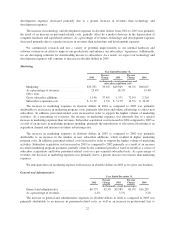
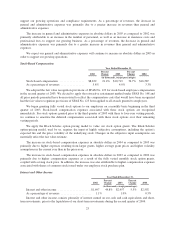
Stock-Based Compensation
Year Ended December 31,
2002
Percent
Change 2003
Percent
Change 2004
(in thousands, except percentages)
Stock-based compensation ................. $8,832 21.4% $10,719 54.7% $16,587
As a percentage of revenues ................ 5.8% 4.0% 3.3%
We adopted the fair value recognition provisions of SFAS No. 123 for stock-based employee compensation
in the second quarter of 2003. We elected to apply the retroactive restatement method under SFAS No. 148 and
all prior periods presented have been restated to reflect the compensation costs that would have been recognized
had the fair value recognition provisions of SFAS No. 123 been applied to all awards granted to employees.
We began granting fully vested stock options to our employees on a monthly basis beginning in the third
quarter of 2003. Stock-based compensation expenses associated with these stock options are recognized
immediately. For stock options granted prior to the third quarter of 2003 with three to four-year vesting periods,
we continue to amortize the deferred compensation associated with these stock options over their remaining
vesting periods.
We apply the Black-Scholes option-pricing model to value our stock option grants. The Black-Scholes
option-pricing model, used by us, requires the input of highly subjective assumptions, including the option’s
expected life and the price volatility of the underlying stock. Changes in the subjective input assumptions can
materially affect the fair value estimate.
The increase in stock-based compensation expenses in absolute dollars in 2004 as compared to 2003 was
primarily due to higher expenses resulting from larger grants, higher average grant prices and higher volatility
assumptions in the current year than in the prior-year.
The increase in stock-based compensation expenses in absolute dollars in 2003 as compared to 2002 was
primarily due to higher compensation expenses as a result of the fully vested monthly stock option grants,
coupled with a rising stock price. In addition, the increase was also attributable to higher compensation expenses
associated with shares of common stock issued under our employee stock purchase plan.
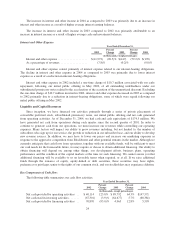
Interest and Other Income
Year Ended December 31,
2002
Percent
Change 2003
Percent
Change 2004
(in thousands, except percentages)
Interest and other income .......................$1,697 44.8% $2,457 5.5% $2,592
As a percentage of revenues ..................... 1.1% 1.0% 0.5%
Interest and other income consists primarily of interest earned on our cash and cash equivalents and short-
term investments, prior to the liquidation of our short-term investments during the second quarter of 2004.
23