NetFlix 2004 Annual Report Download - page 40
Download and view the complete annual report
Please find page 40 of the 2004 NetFlix annual report below. You can navigate through the pages in the report by either clicking on the pages listed below, or by using the keyword search tool below to find specific information within the annual report.-
 1
1 -
2
-
3
-
4
-
5
-
6
-
7
-
8
-
9
-
10
-
11
-
12
-
13
-
14
-
15
-
16
-
17
-
18
-
19
-
20
-
21
-
22
-
23
-
24
-
25
-
26
-
27
-
28
-
29
-
 30
30 -
 31
31 -
 32
32 -
 33
33 -
 34
34 -
 35
35 -
 36
36 -
 37
37 -
 38
38 -
 39
39 -
 40
40 -
 41
41 -
 42
42 -
 43
43 -
 44
44 -
 45
45 -
 46
46 -
 47
47 -
 48
48 -
 49
49 -
 50
50 -
51
-
52
-
53
-
54
-
55
-
56
-
57
-
58
-
59
-
60
-
61
-
62
-
63
-
64
-
65
-
66
-
67
-
68
-
69
-
70
-
71
-
72
-
73
-
74
-
75
-
76
-
77
-
78
-
79
-
80
-
81
-
82
-
83
-
84
-
85
-
86
-
87
-
88
-
89
-
90
-
91
-
92
-
93
-
94
-
95
 |
 |

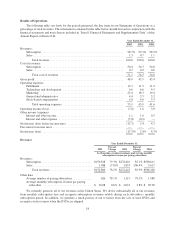
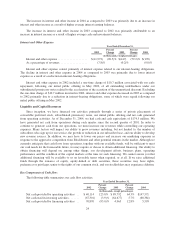
The increase in interest and other income in 2004 as compared to 2003 was primarily due to an increase in
interest and other income as a result of higher average interest earning balances.
The increase in interest and other income in 2003 compared to 2002 was primarily attributable to an
increase in interest income as a result of higher average cash and investment balances.
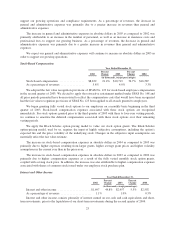
Interest and Other Expense
Year Ended December 31,
2002
Percent
Change 2003
Percent
Change 2004
(in thousands, except percentages)
Interest and other expense .................... $(11,972) (96.5)% $(417) (59.2)% $(170)
As a percentage of revenues .................. (7.8)% (0.2)% (0.0)%
Interest and other expense consist primarily of interest expense related to our interest-bearing obligations.
The decline in interest and other expense in 2004 as compared to 2003 was primarily due to lower interest
expense as a result of a reduction in interest-bearing obligations.
Interest and other expense in 2002 included a one-time charge of $10.7 million associated with our early
repayment, following our initial public offering in May 2002, of all outstanding indebtedness under our
subordinated promissory notes related to the acceleration of the accretion of the unamortized discount. Excluding
the one-time charge of $10.7 million incurred in 2002, interest and other expense decreased in 2003 as compared
to 2002 primarily due to a reduction in interest-bearing obligations, some of which were repaid following our
initial public offering in May 2002.
Liquidity and Capital Resources
Since inception, we have financed our activities primarily through a series of private placements of
convertible preferred stock, subordinated promissory notes, our initial public offering and net cash generated
from operating activities. As of December 31, 2004, we had cash and cash equivalents of $174.5 million. We
have generated net cash from operations during each quarter since the second quarter of 2001. In order to
continue to generate cash from our operations, we must increase our revenues while controlling our operating
expenses. Many factors will impact our ability to grow revenues including, but not limited to, the number of
subscribers who sign up for our service, the growth or reduction in our subscriber base, and our ability to develop
new revenue sources. In addition, we may have to lower our prices and increase our marketing expenses in
response to the aggressive competition from Blockbuster and other potential entrants in the market. Although we
currently anticipate that cash flows from operations, together with our available funds, will be sufficient to meet
our cash needs for the foreseeable future, we may require or choose to obtain additional financing. Our ability to
obtain financing will depend on, among other things, our development efforts, business plans, operating
performance and the condition of the capital markets at the time we seek financing. We cannot assure you that
additional financing will be available to us on favorable terms when required, or at all. If we raise additional
funds through the issuance of equity, equity-linked or debt securities, those securities may have rights,
preferences or privileges senior to the rights of our common stock, and our stockholders may experience dilution.
Key Components of Cash flow:
The following table summarizes our cash flow activities:
Year Ended December 31,
2002
Percent
Change 2003
Percent
Change 2004
(in thousands, except percentages)
Net cash provided by operating activities . . $ 40,114 123.8% $ 89,792 64.3% $147,571
Net cash used in investing activities ....... (67,301) (3.9)% (64,677) 5.7% (68,381)
Net cash provided by financing activities . . 70,870 (93.0)% 4,965 12.8% 5,599
24