NetFlix 2004 Annual Report Download - page 37
Download and view the complete annual report
Please find page 37 of the 2004 NetFlix annual report below. You can navigate through the pages in the report by either clicking on the pages listed below, or by using the keyword search tool below to find specific information within the annual report.-
 1
1 -
2
-
3
-
4
-
5
-
6
-
7
-
8
-
9
-
10
-
11
-
12
-
13
-
14
-
15
-
16
-
17
-
18
-
19
-
20
-
21
-
22
-
23
-
24
-
25
-
26
-
 27
27 -
 28
28 -
 29
29 -
 30
30 -
 31
31 -
 32
32 -
 33
33 -
 34
34 -
 35
35 -
 36
36 -
 37
37 -
 38
38 -
 39
39 -
 40
40 -
 41
41 -
 42
42 -
 43
43 -
 44
44 -
 45
45 -
 46
46 -
 47
47 -
48
-
49
-
50
-
51
-
52
-
53
-
54
-
55
-
56
-
57
-
58
-
59
-
60
-
61
-
62
-
63
-
64
-
65
-
66
-
67
-
68
-
69
-
70
-
71
-
72
-
73
-
74
-
75
-
76
-
77
-
78
-
79
-
80
-
81
-
82
-
83
-
84
-
85
-
86
-
87
-
88
-
89
-
90
-
91
-
92
-
93
-
94
-
95
 |
 |

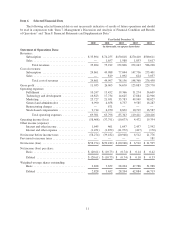
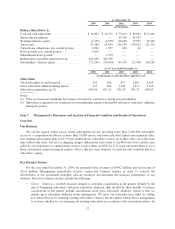
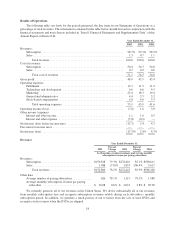
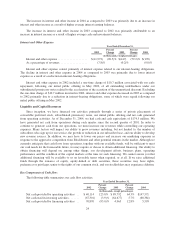
Gross Margin
Year Ended December 31,
2002
Percent
Change 2003
Percent
Change 2004
(in thousands, except percentages)
Grossprofit .......................... $74,670 65.9% $123,883 85.5% $229,770
Grossmargin ......................... 48.9% 45.5% 45.4%
Gross margin for 2004 declined slightly in 2004 as compared to 2003. This decline was attributable to the
decline in revenue per paid shipment offset almost wholly by the change in estimate related to the useful life of
our back-catalogue DVD library. If movie rentals per average paying subscriber increases, additional erosion in
our gross margin will occur.
The decline in gross margin in 2003 as compared to 2002 was primarily due to a higher percentage of DVD
amortization as a result of increased acquisitions for our library, coupled with a higher percentage of postage and
packaging expenses as a result of an increase in movie rentals per average paying subscriber. The decrease in
gross margin was partially offset by a lower percentage of revenue sharing expenses as a result of our rental mix
shifting proportionately in favor of purchased titles and away from titles subject to revenue sharing agreements.
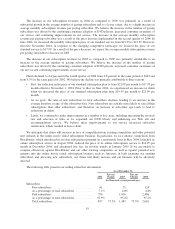
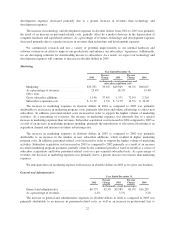
Operating Expenses:
Fulfillment
Year Ended December 31,
2002
Percent
Change 2003
Percent
Change 2004
(in thousands, except percentages)
Fulfillment ............................. $19,366 61.5% $31,274 81.0% $56,609
As a percentage of revenues ............... 12.7% 11.5% 11.2%
The increase in fulfillment expenses in absolute dollars in 2004 as compared to 2003 was primarily
attributable to an increase in personnel-related costs resulting from the higher volume of activities in our
customer service and shipping centers, coupled with an increase in credit card fees as a result of the increase in
subscriptions. In addition, the increase in fulfillment expenses was attributable to an increase in facility-related
costs resulting from the relocation or expansion of certain of our shipping centers and the addition of new ones.
As a percentage of revenues, fulfillment expenses decreased slightly primarily due to a combination of an
increasing revenue base and efficiencies that reduced the fulfillment costs per paid shipment by approximately 10
percent.
The increase in fulfillment expenses in absolute dollars in 2003 as compared to 2002 was primarily
attributable to an increase in personnel-related costs resulting from the higher volume of activities in our
customer service and shipping centers. In addition, our credit card fees increased significantly in 2003 compared
to 2002 as a result of the increase in subscriptions. As a percentage of revenues, fulfillment expenses decreased
in 2003 compared to 2002, primarily due to a combination of an increasing revenue base and improvements in
our fulfillment productivity due to our continuous efforts to refine and streamline our fulfillment operations.
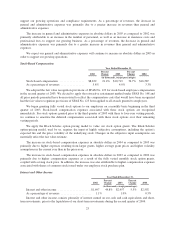
Technology and Development
Year Ended December 31,
2002
Percent
Change 2003
Percent
Change 2004
(in thousands, except percentages)
Technology and development .............. $14,625 22.3% $17,884 28.1% $22,906
As a percentage of revenues ............... 9.6% 6.6% 4.5%
The increase in technology and development expenses in absolute dollars in 2004 as compared to 2003 was
primarily the result of an increase in personnel-related costs. As a percentage of revenues, technology and
21