Neiman Marcus 2013 Annual Report Download - page 67
Download and view the complete annual report
Please find page 67 of the 2013 Neiman Marcus annual report below. You can navigate through the pages in the report by either clicking on the pages listed below, or by using the keyword search tool below to find specific information within the annual report.-
 1
1 -
2
-
3
-
4
-
5
-
6
-
7
-
8
-
9
-
10
-
11
-
12
-
13
-
14
-
15
-
16
-
17
-
18
-
19
-
20
-
21
-
22
-
23
-
24
-
25
-
26
-
27
-
28
-
29
-
30
-
31
-
32
-
33
-
34
-
35
-
36
-
37
-
38
-
39
-
40
-
41
-
42
-
43
-
44
-
45
-
46
-
47
-
48
-
49
-
50
-
51
-
52
-
53
-
54
-
55
-
56
-
 57
57 -
 58
58 -
 59
59 -
 60
60 -
 61
61 -
 62
62 -
 63
63 -
 64
64 -
 65
65 -
 66
66 -
 67
67 -
 68
68 -
 69
69 -
 70
70 -
 71
71 -
 72
72 -
 73
73 -
 74
74 -
 75
75 -
 76
76 -
 77
77 -
78
-
79
-
80
-
81
-
82
-
83
-
84
-
85
-
86
-
87
-
88
-
89
-
90
-
91
-
92
-
93
-
94
-
95
-
96
-
97
-
98
-
99
-
100
-
101
-
102
-
103
-
104
-
105
-
106
-
107
-
108
-
109
-
110
-
111
-
112
-
113
-
114
-
115
-
116
-
117
-
118
-
119
-
120
-
121
-
122
-
123
-
124
-
125
-
126
-
127
-
128
-
129
-
130
-
131
-
132
-
133
-
134
-
135
-
136
-
137
-
138
-
139
-
140
-
141
-
142
-
143
-
144
-
145
-
146
-
147
-
148
-
149
-
150
-
151
-
152
-
153
-
154
-
155
-
156
-
157
-
158
-
159
-
160
-
161
-
162
-
163
-
164
-
165
-
166
-
167
-
168
-
169
-
170
-
171
-
172
-
173
-
174
-
175
-
176
-
177
-
178
-
179
-
180
-
181
-
182
-
183
-
184
-
185
-
186
-
187
-
188
-
189
-
190
-
191
-
192
-
193
-
194
-
195
-
196
-
197
-
198
-
199
-
200
-
201
-
202
-
203
 |
 |
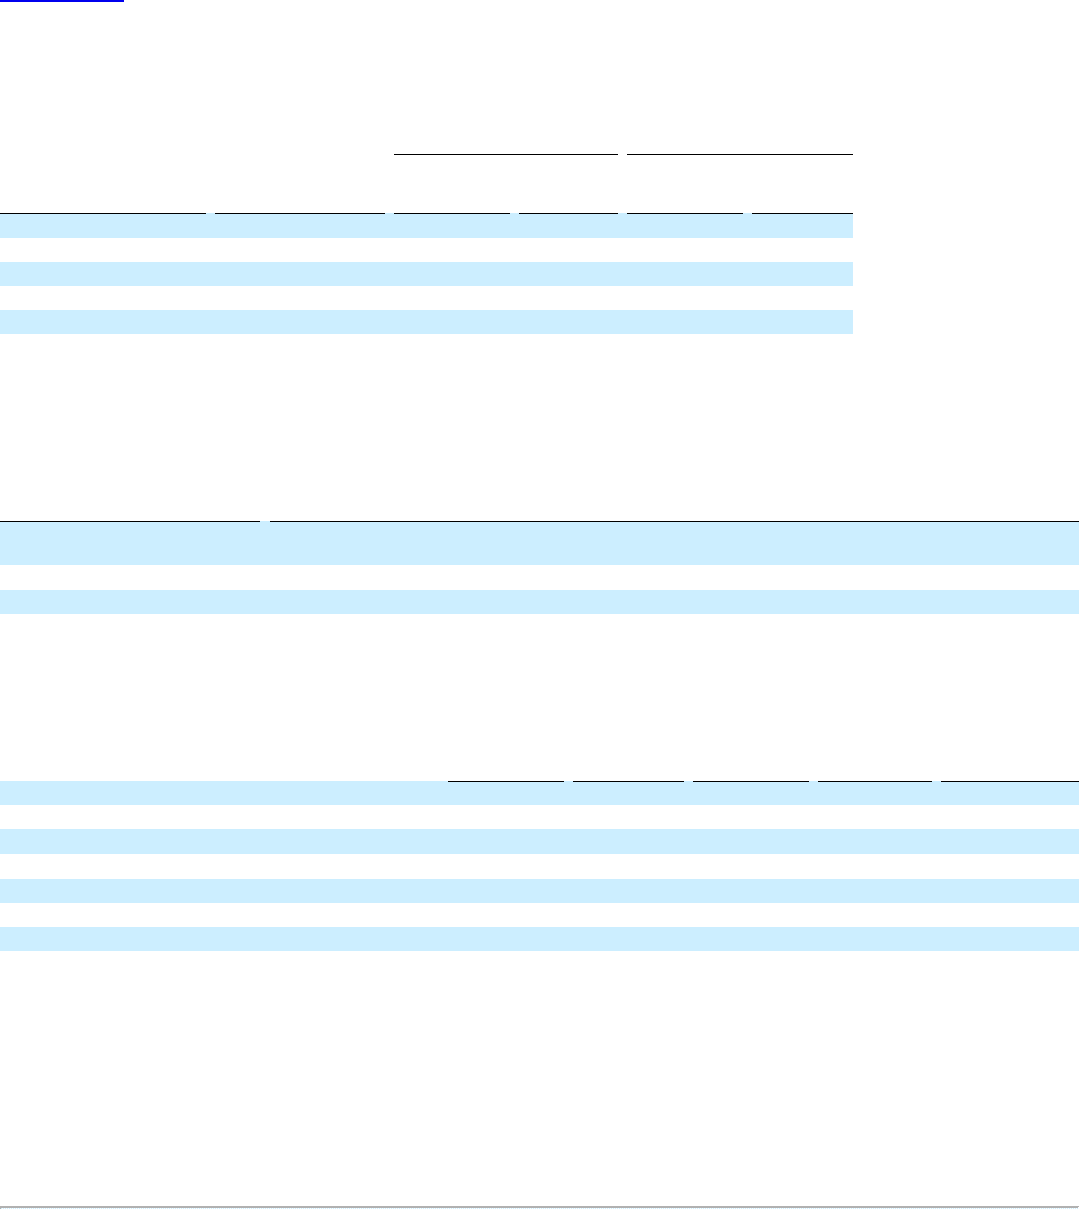
Table of Contents
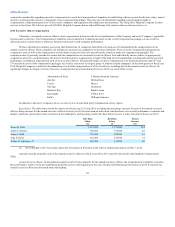
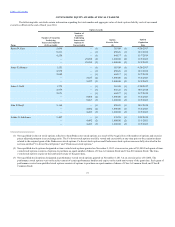
“Corporate Performance Targets” that follows. The Compensation Committee set the threshold, target and maximum performance targets at levels they
believed were challenging based on historical company performance and industry and market conditions. Goals were established at the division and business
unit levels where appropriate for each of the named executive officers. As it relates to our annual incentive compensation program, this performance
assessment is a key variable in determining the amount of total compensation paid to our named executive officers. Fiscal year 2014 target annual incentives
and relative performance weights for the named executive officers were as follows:
Karen W. Katz
70%
30%
—
—
James E. Skinner
70%
30%
—
—
James J. Gold
70%
30%
—
—
John E. Koryl
70%
30%
—
—
Joshua G. Schulman
35%
15%
35%
15%
Ms. Katz, the individual with the greatest overall responsibility for company performance, was granted the largest incentive opportunity in
comparison to her base salary to weight her annual cash compensation mix more heavily towards performance-based compensation. Since Mr. Schulman has
responsibility over Bergdorf Goodman, his performance goals include the operational performance of Bergdorf Goodman.
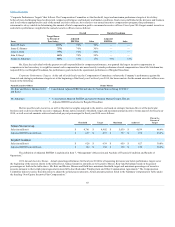
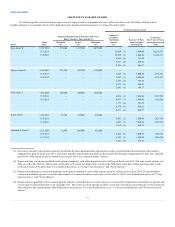
Corporate Performance Targets. At the end of each fiscal year, the Compensation Committee evaluates the Company’s performance against the
financial and strategic performance targets set at the beginning of the fiscal year. For fiscal year 2014, the bonus metrics for the named executive officers were
based on the following:
Ms. Katz and Messrs. Skinner, Gold
and Koryl
Ÿ Consolidated Adjusted EBITDA and sales for Neiman Marcus Group LTD LLC
Mr. Schulman Ÿ Consolidated Adjusted EBITDA and sales for Neiman Marcus Group LTD LLC
Ÿ Adjusted EBITDA and sales for Bergdorf Goodman
Metrics used for each executive, as well as the relative weights assigned to the metrics, are based on strategic business drivers of the particular
business unit or division that the executive manages. Bonus metrics related to threshold, target and maximum annual incentive bonus payouts for fiscal year
2014, as well as actual amounts achieved and actual payout percentages for fiscal year 2014 are as follows:
Sales (in millions) $ 4,761
$ 4,902
$ 5,039
$ 4,839
66.6%
Adjusted EBITDA (in millions) $ 657
$ 697
$ 737
$ 678
63.8%
Sales (in millions) $ 626
$ 639
$ 659
$ 627
30.0%
Adjusted EBITDA (in millions) $ 124
$ 130
$ 136
$ 130
96.4%
The definition of Adjusted EBITDA is explained in Item 7, “Management’s Discussion and Analysis of Financial Condition and Results of
Operations.”
2014 Annual Incentive Bonus. Actual operating performance for fiscal year 2014 for all operating divisions was below performance targets set at
the beginning of the year (as shown in the table above). Annual incentive amounts are to be paid to Messrs. Koryl and Schulman based on the payout
percentages set forth in the table above. Ms. Katz and Messrs. Skinner and Gold have minimum threshold, target and maximum percentages of incentive
payouts pursuant to their employment agreements more fully described under "Employment and Other Compensation Agreements." The Compensation
Committee did not exercise their discretion to adjust the actual payout amounts. Actual amounts paid are listed in the Summary Compensation Table under
the heading “Non-Equity Incentive Plan Compensation.”
65