Neiman Marcus 2013 Annual Report Download - page 44
Download and view the complete annual report
Please find page 44 of the 2013 Neiman Marcus annual report below. You can navigate through the pages in the report by either clicking on the pages listed below, or by using the keyword search tool below to find specific information within the annual report.-
 1
1 -
2
-
3
-
4
-
5
-
6
-
7
-
8
-
9
-
10
-
11
-
12
-
13
-
14
-
15
-
16
-
17
-
18
-
19
-
20
-
21
-
22
-
23
-
24
-
25
-
26
-
27
-
28
-
29
-
30
-
31
-
32
-
33
-
 34
34 -
 35
35 -
 36
36 -
 37
37 -
 38
38 -
 39
39 -
 40
40 -
 41
41 -
 42
42 -
 43
43 -
 44
44 -
 45
45 -
 46
46 -
 47
47 -
 48
48 -
 49
49 -
 50
50 -
 51
51 -
 52
52 -
 53
53 -
 54
54 -
55
-
56
-
57
-
58
-
59
-
60
-
61
-
62
-
63
-
64
-
65
-
66
-
67
-
68
-
69
-
70
-
71
-
72
-
73
-
74
-
75
-
76
-
77
-
78
-
79
-
80
-
81
-
82
-
83
-
84
-
85
-
86
-
87
-
88
-
89
-
90
-
91
-
92
-
93
-
94
-
95
-
96
-
97
-
98
-
99
-
100
-
101
-
102
-
103
-
104
-
105
-
106
-
107
-
108
-
109
-
110
-
111
-
112
-
113
-
114
-
115
-
116
-
117
-
118
-
119
-
120
-
121
-
122
-
123
-
124
-
125
-
126
-
127
-
128
-
129
-
130
-
131
-
132
-
133
-
134
-
135
-
136
-
137
-
138
-
139
-
140
-
141
-
142
-
143
-
144
-
145
-
146
-
147
-
148
-
149
-
150
-
151
-
152
-
153
-
154
-
155
-
156
-
157
-
158
-
159
-
160
-
161
-
162
-
163
-
164
-
165
-
166
-
167
-
168
-
169
-
170
-
171
-
172
-
173
-
174
-
175
-
176
-
177
-
178
-
179
-
180
-
181
-
182
-
183
-
184
-
185
-
186
-
187
-
188
-
189
-
190
-
191
-
192
-
193
-
194
-
195
-
196
-
197
-
198
-
199
-
200
-
201
-
202
-
203
 |
 |

Table of Contents
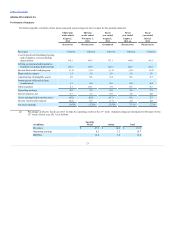
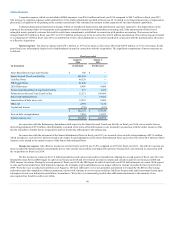
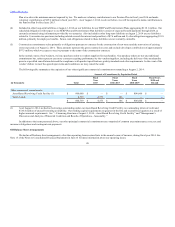
Amortization of intangible assets (primarily customer lists and favorable lease commitments) aggregated $47.4 million, or 1.0% of revenues, in fiscal
year 2013 compared to $50.1 million, or 1.1% of revenues, in fiscal year 2012. The decrease in amortization expense is primarily due to certain short-lived
intangible assets becoming fully amortized.
Other expenses. Other expenses in fiscal year 2013 aggregated $23.1 million, or 0.5% of revenues, compared to $11.5 million, or 0.3% of revenues,
in fiscal year 2012. The increase in other expenses in fiscal year 2013 was primarily due to $13.1 million of our equity in the losses of our investment in a
foreign e-commerce retailer.
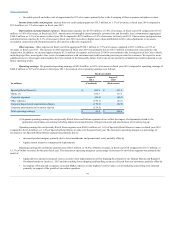
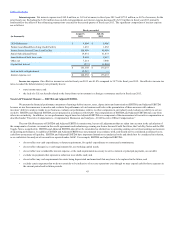
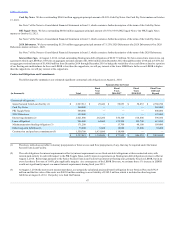
Operating earnings. Total operating earnings in fiscal year 2013 were $446.4 million, or 9.6% of revenues, compared to $403.6 million, or 9.3% of
revenues, in fiscal year 2012. An analysis of our operating earnings is as follows:
Specialty Retail Stores (1)
$ 411.4
$ 391.2
Online (1)
157.7
132.4
Corporate expenses
(46.7)
(53.2)
Other expenses
(23.1)
(11.5)
Corporate depreciation/amortization charges
(52.9)
(55.3)
Total operating earnings
$ 446.4
$ 403.6
(1) Segment operating earnings for our Specialty Retail Stores and Online segments do not reflect either the impact of adjustments to revalue our
assets and liabilities to estimated fair value in connection with purchase accounting.
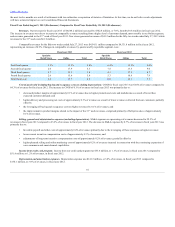
Operating earnings for our Specialty Retail Stores segment were $411.4 million, or 11.4% of Specialty Retail Stores revenues, in fiscal year 2013
compared to $391.2 million, or 11.3% of Specialty Retail Stores revenues, for the prior fiscal year. The increase in operating margin as a percentage of
revenues for our Specialty Retail Stores segment was primarily due to:
• lower SG&A expenses primarily due to lower current incentive compensation costs; partially offset by
• decreased product margins as a result of higher promotional costs and markdowns.
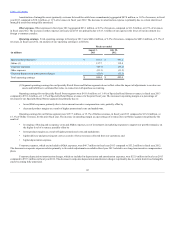
Operating earnings for our Online segment were $157.7 million, or 15.3% of Online revenues, in fiscal year 2013 compared to $132.4 million, or
15.1% of Online revenues, for the prior fiscal year. The increase in operating margin as a percentage of revenues for our Online segment was primarily the
result of:
• leveraging of buying and occupancy costs and SG&A expenses, net of investments in marketing expenses to support our growth strategies, on
the higher level of revenues; partially offset by
• lower product margins as a result of higher promotional costs and markdowns;
• higher delivery and processing net costs as a result of lower revenues collected from our customers; and
• higher depreciation expense.
Corporate expenses, which are included in SG&A expenses, were $46.7 million in fiscal year 2013 compared to $53.2 million in fiscal year 2012.
The decrease in corporate expenses relates primarily to favorable adjustments recorded in fiscal year 2013 related to our long-term incentive compensation
plans.
Corporate depreciation/amortization charges, which are included in depreciation and amortization expenses, were $52.9 million in fiscal year 2013
compared to $55.3 million in fiscal year 2012. The decrease in corporate depreciation/amortization charges is primarily due to certain short-lived intangible
assets becoming fully amortized.
42