Neiman Marcus 2013 Annual Report Download - page 35
Download and view the complete annual report
Please find page 35 of the 2013 Neiman Marcus annual report below. You can navigate through the pages in the report by either clicking on the pages listed below, or by using the keyword search tool below to find specific information within the annual report.
Table of Contents
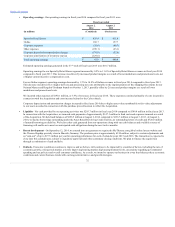
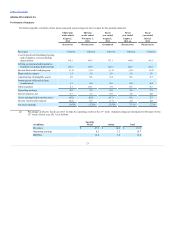
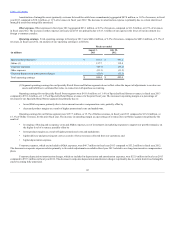
Set forth in the following table is certain summary information with respect to our operations for the periods indicated (figures may not sum due to
rounding).
REVENUES
Specialty Retail Stores
$ 2,801.5
$ 889.3
$ 3,690.8
$ 3,616.9
$ 3,466.6
Online
908.7
239.8
1,148.5
1,031.3
878.8
Total
$ 3,710.2
$ 1,129.1
$ 4,839.3
$ 4,648.2
$ 4,345.4
OPERATING EARNINGS
Specialty Retail Stores
$ 288.6
$ 138.2
$ 426.9
$ 411.4
$ 391.2
Online
126.9
33.8
160.7
157.7
132.4
Corporate expenses
(43.1)
(12.9)
(56.0)
(46.7)
(53.2)
Other expenses
(76.3)
(113.7)
(190.1)
(23.1)
(11.5)
Corporate depreciation/amortization charges
(157.7)
(13.2)
(170.9)
(52.9)
(55.3)
Corporate amortization of inventory step-up
(129.6)
—
(129.6)
—
—
Total
$ 8.8
$ 32.1
$ 41.0
$ 446.4
$ 403.6
OPERATING PROFIT MARGIN
Specialty Retail Stores
10.3%
15.5%
11.6%
11.4%
11.3%
Online
14.0%
14.1%
14.0%
15.3%
15.1%
Total
0.2%
2.8%
0.8%
9.6%
9.3%
CHANGE IN COMPARABLE REVENUES (2)
Specialty Retail Stores
3.0%
4.5%
3.4%
2.2%
6.0%
Online
13.6%
10.4%
12.9%
15.7%
16.1%
Total
5.4%
5.7%
5.5%
4.9%
7.9%
SALES PER SQUARE FOOT (3)
Specialty Retail Stores
$ 441
$ 138
$ 579
$ 552
$ 535
STORE COUNT
Neiman Marcus and Bergdorf Goodman full-line stores:
Open at beginning of period
43
43
43
44
43
Opened during the period
—
—
—
—
1
Closed during the period
—
—
—
(1)
—
Open at end of period
43
43
43
43
44
Last Call stores:
Open at beginning of period
36
36
36
33
30
Opened during the period
2
—
2
3
4
Closed during the period
—
—
—
—
(1)
Open at end of period
38
36
38
36
33
NON-GAAP FINANCIAL MEASURES
EBITDA (4)
$ 270.8
$ 78.1
$ 348.9
$ 635.3
$ 583.8
Adjusted EBITDA (4)
$ 484.4
$ 193.2
$ 677.6
$ 671.5
$ 603.1
(1) Fiscal year 2013 consists of the fifty-three weeks ended August 3, 2013, except where noted. In fiscal year 2013, we generated revenues of $61.9
million and EBITDA of $13.6 million in the 53rd week.


