Neiman Marcus 2013 Annual Report Download - page 56
Download and view the complete annual report
Please find page 56 of the 2013 Neiman Marcus annual report below. You can navigate through the pages in the report by either clicking on the pages listed below, or by using the keyword search tool below to find specific information within the annual report.-
 1
1 -
2
-
3
-
4
-
5
-
6
-
7
-
8
-
9
-
10
-
11
-
12
-
13
-
14
-
15
-
16
-
17
-
18
-
19
-
20
-
21
-
22
-
23
-
24
-
25
-
26
-
27
-
28
-
29
-
30
-
31
-
32
-
33
-
34
-
35
-
36
-
37
-
38
-
39
-
40
-
41
-
42
-
43
-
44
-
45
-
 46
46 -
 47
47 -
 48
48 -
 49
49 -
 50
50 -
 51
51 -
 52
52 -
 53
53 -
 54
54 -
 55
55 -
 56
56 -
 57
57 -
 58
58 -
 59
59 -
 60
60 -
 61
61 -
 62
62 -
 63
63 -
 64
64 -
 65
65 -
 66
66 -
67
-
68
-
69
-
70
-
71
-
72
-
73
-
74
-
75
-
76
-
77
-
78
-
79
-
80
-
81
-
82
-
83
-
84
-
85
-
86
-
87
-
88
-
89
-
90
-
91
-
92
-
93
-
94
-
95
-
96
-
97
-
98
-
99
-
100
-
101
-
102
-
103
-
104
-
105
-
106
-
107
-
108
-
109
-
110
-
111
-
112
-
113
-
114
-
115
-
116
-
117
-
118
-
119
-
120
-
121
-
122
-
123
-
124
-
125
-
126
-
127
-
128
-
129
-
130
-
131
-
132
-
133
-
134
-
135
-
136
-
137
-
138
-
139
-
140
-
141
-
142
-
143
-
144
-
145
-
146
-
147
-
148
-
149
-
150
-
151
-
152
-
153
-
154
-
155
-
156
-
157
-
158
-
159
-
160
-
161
-
162
-
163
-
164
-
165
-
166
-
167
-
168
-
169
-
170
-
171
-
172
-
173
-
174
-
175
-
176
-
177
-
178
-
179
-
180
-
181
-
182
-
183
-
184
-
185
-
186
-
187
-
188
-
189
-
190
-
191
-
192
-
193
-
194
-
195
-
196
-
197
-
198
-
199
-
200
-
201
-
202
-
203
 |
 |

Table of Contents
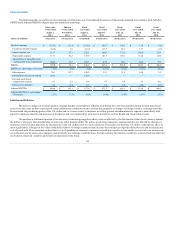
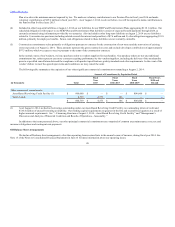
The market risk inherent in our financial instruments represents the potential loss arising from adverse changes in interest rates. We do not enter into
derivative financial instruments for trading purposes. We seek to manage exposure to adverse interest rate changes through our normal operating and
financing activities. We are exposed to interest rate risk through our borrowing activities, which are described in Note 7 of the Notes to Consolidated
Financial Statements.
At August 2, 2014, we had outstanding floating rate debt obligations of $2,927.9 million consisting of outstanding borrowings under our Senior
Secured Term Loan Facility. Borrowings pursuant to the Senior Secured Term Loan Facility bear interest at floating rates, primarily based on LIBOR, but in
no event less than a floor rate of 1.00%, plus applicable margins. The interest rate on the outstanding borrowings pursuant to the Senior Secured Term Loan
Facility was 4.25% at August 2, 2014. A further description of the terms of the Senior Secured Term Loan Facility are set forth in Note 7 of the Notes to
Consolidated Financial Statements.
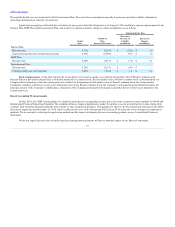
We have entered into interest rate cap agreements which cap LIBOR at 2.50% for an aggregate notional amount of $1,000.0 million from
December 2012 through December 2014 and at 3.00% for an aggregate notional amount of $1,400.0 million from December 2014 through December 2016 to
hedge the variability of our cash flows related to a portion of our floating rate indebtedness. In the event LIBOR is less than the capped rate, we will pay
interest at the lower LIBOR rate. In the event LIBOR is higher than the capped rate, we will pay interest at the capped rate. As of August 2, 2014, three-month
LIBOR was 0.23%. As a consequence of the LIBOR floor rate described above, we estimate that a 1% increase in LIBOR would not significantly impact our
annual interest requirements during fiscal year 2015.
The effects of changes in the U.S. equity and bond markets serve to increase or decrease the value of pension plan assets, resulting in increased or
decreased cash funding by us. We seek to manage exposure to adverse equity and bond returns by maintaining diversified investment portfolios and utilizing
professional investment managers.
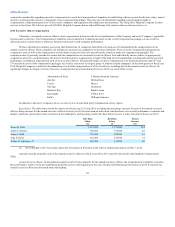
The following Consolidated Financial Statements of the Company and supplementary data are included as pages F-1 through F-50 at the end of this
Annual Report on Form 10-K:
Management’s Report on Internal Control Over Financial Reporting F-2
Reports of Independent Registered Public Accounting Firm F-3
Consolidated Balance Sheets F-5
Consolidated Statements of Operations F-6
Consolidated Statements of Comprehensive (Loss) Earnings F-7
Consolidated Statements of Cash Flows F-8
Consolidated Statements of Member Equity / Stockholders’ Equity F-9
Notes to Consolidated Financial Statements F-11
None.
In accordance with Exchange Act Rules 13a-15 and 15d-15, we carried out an evaluation as of August 2, 2014, under the supervision and with the
participation of our Chief Executive Officer and Chief Financial Officer, as well as other key members of our management, of the effectiveness of our
disclosure controls and procedures (as defined in Rule 13a-15(e) and
54