Neiman Marcus 2013 Annual Report Download - page 145
Download and view the complete annual report
Please find page 145 of the 2013 Neiman Marcus annual report below. You can navigate through the pages in the report by either clicking on the pages listed below, or by using the keyword search tool below to find specific information within the annual report.-
 1
1 -
2
-
3
-
4
-
5
-
6
-
7
-
8
-
9
-
10
-
11
-
12
-
13
-
14
-
15
-
16
-
17
-
18
-
19
-
20
-
21
-
22
-
23
-
24
-
25
-
26
-
27
-
28
-
29
-
30
-
31
-
32
-
33
-
34
-
35
-
36
-
37
-
38
-
39
-
40
-
41
-
42
-
43
-
44
-
45
-
46
-
47
-
48
-
49
-
50
-
51
-
52
-
53
-
54
-
55
-
56
-
57
-
58
-
59
-
60
-
61
-
62
-
63
-
64
-
65
-
66
-
67
-
68
-
69
-
70
-
71
-
72
-
73
-
74
-
75
-
76
-
77
-
78
-
79
-
80
-
81
-
82
-
83
-
84
-
85
-
86
-
87
-
88
-
89
-
90
-
91
-
92
-
93
-
94
-
95
-
96
-
97
-
98
-
99
-
100
-
101
-
102
-
103
-
104
-
105
-
106
-
107
-
108
-
109
-
110
-
111
-
112
-
113
-
114
-
115
-
116
-
117
-
118
-
119
-
120
-
121
-
122
-
123
-
124
-
125
-
126
-
127
-
128
-
129
-
130
-
131
-
132
-
133
-
134
-
 135
135 -
 136
136 -
 137
137 -
 138
138 -
 139
139 -
 140
140 -
 141
141 -
 142
142 -
 143
143 -
 144
144 -
 145
145 -
 146
146 -
 147
147 -
 148
148 -
 149
149 -
 150
150 -
 151
151 -
 152
152 -
 153
153 -
 154
154 -
 155
155 -
156
-
157
-
158
-
159
-
160
-
161
-
162
-
163
-
164
-
165
-
166
-
167
-
168
-
169
-
170
-
171
-
172
-
173
-
174
-
175
-
176
-
177
-
178
-
179
-
180
-
181
-
182
-
183
-
184
-
185
-
186
-
187
-
188
-
189
-
190
-
191
-
192
-
193
-
194
-
195
-
196
-
197
-
198
-
199
-
200
-
201
-
202
-
203
 |
 |

Table of Contents
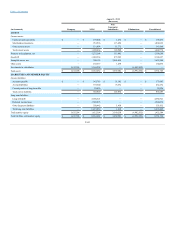
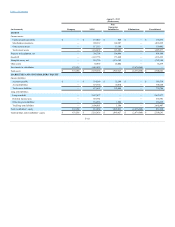
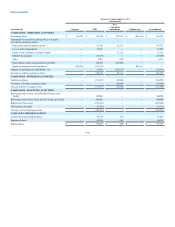
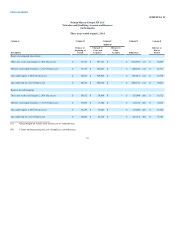
Net earnings (loss)
$ 140,086
$ 140,086
$ 317,162
$ (457,248)
$ 140,086
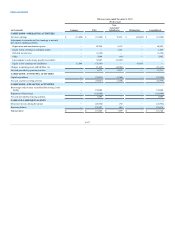
Adjustments to reconcile net earnings (loss) to net cash
provided by operating activities:
Depreciation and amortization expense
—
161,823
26,876
—
188,699
Equity in loss of foreign e-commerce retailer
—
—
1,514
—
1,514
Deferred income taxes
—
(10,094)
—
—
(10,094)
Other
—
6,884
120
—
7,004
Intercompany royalty income payable (receivable)
—
204,181
(204,181)
—
—
Equity in (earnings) loss of subsidiaries
(140,086)
(317,162)
—
457,248
—
Changes in operating assets and liabilities, net
—
29,830
(97,229)
—
(67,399)
Net cash provided by operating activities
—
215,548
44,262
—
259,810
Capital expenditures
—
(138,216)
(14,622)
—
(152,838)
Investment in foreign e-commerce retailer
—
—
(29,421)
—
(29,421)
Net cash used for investing activities
—
(138,216)
(44,043)
—
(182,259)
Borrowings under Former Asset-Based Revolving Credit
Facility
—
175,000
—
—
175,000
Repayment of borrowings
—
(75,000)
—
—
(75,000)
Distributions to stockholders
—
(449,295)
—
—
(449,295)
Debt issuance costs paid
—
(594)
—
—
(594)
Net cash used for financing activities
—
(349,889)
—
—
(349,889)
(Decrease) increase during the period
—
(272,557)
219
—
(272,338)
Beginning balance
—
320,865
726
—
321,591
Ending balance
$ —
$ 48,308
$ 945
$ —
$ 49,253
F-49