Neiman Marcus 2013 Annual Report Download - page 105
Download and view the complete annual report
Please find page 105 of the 2013 Neiman Marcus annual report below. You can navigate through the pages in the report by either clicking on the pages listed below, or by using the keyword search tool below to find specific information within the annual report.-
 1
1 -
2
-
3
-
4
-
5
-
6
-
7
-
8
-
9
-
10
-
11
-
12
-
13
-
14
-
15
-
16
-
17
-
18
-
19
-
20
-
21
-
22
-
23
-
24
-
25
-
26
-
27
-
28
-
29
-
30
-
31
-
32
-
33
-
34
-
35
-
36
-
37
-
38
-
39
-
40
-
41
-
42
-
43
-
44
-
45
-
46
-
47
-
48
-
49
-
50
-
51
-
52
-
53
-
54
-
55
-
56
-
57
-
58
-
59
-
60
-
61
-
62
-
63
-
64
-
65
-
66
-
67
-
68
-
69
-
70
-
71
-
72
-
73
-
74
-
75
-
76
-
77
-
78
-
79
-
80
-
81
-
82
-
83
-
84
-
85
-
86
-
87
-
88
-
89
-
90
-
91
-
92
-
93
-
94
-
 95
95 -
 96
96 -
 97
97 -
 98
98 -
 99
99 -
 100
100 -
 101
101 -
 102
102 -
 103
103 -
 104
104 -
 105
105 -
 106
106 -
 107
107 -
 108
108 -
 109
109 -
 110
110 -
 111
111 -
 112
112 -
 113
113 -
 114
114 -
 115
115 -
116
-
117
-
118
-
119
-
120
-
121
-
122
-
123
-
124
-
125
-
126
-
127
-
128
-
129
-
130
-
131
-
132
-
133
-
134
-
135
-
136
-
137
-
138
-
139
-
140
-
141
-
142
-
143
-
144
-
145
-
146
-
147
-
148
-
149
-
150
-
151
-
152
-
153
-
154
-
155
-
156
-
157
-
158
-
159
-
160
-
161
-
162
-
163
-
164
-
165
-
166
-
167
-
168
-
169
-
170
-
171
-
172
-
173
-
174
-
175
-
176
-
177
-
178
-
179
-
180
-
181
-
182
-
183
-
184
-
185
-
186
-
187
-
188
-
189
-
190
-
191
-
192
-
193
-
194
-
195
-
196
-
197
-
198
-
199
-
200
-
201
-
202
-
203
 |
 |

Table of Contents
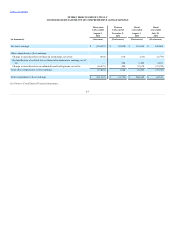
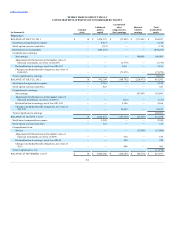
Predecessor:
BALANCE AT JULY 30, 2011
$ 10
$ 1,438,393
$ (73,045)
$ (371,061)
$ 994,297
Stock-based compensation expense
—
6,914
—
—
6,914
Stock option exercises and other
—
(712)
—
—
(712)
Distributions to stockholders
—
(449,295)
—
—
(449,295)
Comprehensive earnings:
Net earnings
—
—
—
140,086
140,086
Adjustments for fluctuations in fair market value of
financial instruments, net of tax of ($2,457)
—
—
(3,779)
—
(3,779)
Reclassification to earnings, net of tax of $1,307
—
—
2,011
—
2,011
Change in unfunded benefit obligations, net of tax of
($48,099)
—
—
(73,979)
—
(73,979)
Total comprehensive earnings
64,339
BALANCE AT JULY 28, 2012
10
995,300
(148,792)
(230,975)
615,543
Stock-based compensation expense
—
9,710
—
—
9,710
Stock option exercises and other
—
823
—
—
823
Comprehensive earnings:
Net earnings
—
—
—
163,699
163,699
Adjustments for fluctuations in fair market value of
financial instruments, net of tax of ($333)
—
—
(513)
—
(513)
Reclassification to earnings, net of tax of $1,369
—
—
2,106
—
2,106
Change in unfunded benefit obligations, net of tax of
$25,792
—
—
39,670
—
39,670
Total comprehensive earnings
204,962
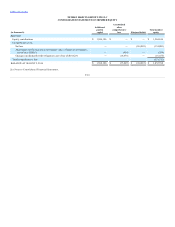
BALANCE AT AUGUST 3, 2013
10
1,005,833
(107,529)
(67,276)
831,038
Stock-based compensation expense
—
2,548
—
—
2,548
Stock option exercises and other
—
125
—
—
125
Comprehensive loss:
Net loss
—
—
—
(13,098)
(13,098)
Adjustments for fluctuations in fair market value of
financial instruments, net of tax of $396
—
—
610
—
610
Reclassification to earnings, net of tax of $145
—
—
224
—
224
Change in unfunded benefit obligations, net of tax of
$319
—
—
490
—
490
Total comprehensive loss
(11,774)
BALANCE AT NOVEMBER 2, 2013
$ 10
$ 1,008,506
$ (106,205)
$ (80,374)
$ 821,937
F-9