Neiman Marcus 2013 Annual Report Download - page 66
Download and view the complete annual report
Please find page 66 of the 2013 Neiman Marcus annual report below. You can navigate through the pages in the report by either clicking on the pages listed below, or by using the keyword search tool below to find specific information within the annual report.-
 1
1 -
2
-
3
-
4
-
5
-
6
-
7
-
8
-
9
-
10
-
11
-
12
-
13
-
14
-
15
-
16
-
17
-
18
-
19
-
20
-
21
-
22
-
23
-
24
-
25
-
26
-
27
-
28
-
29
-
30
-
31
-
32
-
33
-
34
-
35
-
36
-
37
-
38
-
39
-
40
-
41
-
42
-
43
-
44
-
45
-
46
-
47
-
48
-
49
-
50
-
51
-
52
-
53
-
54
-
55
-
 56
56 -
 57
57 -
 58
58 -
 59
59 -
 60
60 -
 61
61 -
 62
62 -
 63
63 -
 64
64 -
 65
65 -
 66
66 -
 67
67 -
 68
68 -
 69
69 -
 70
70 -
 71
71 -
 72
72 -
 73
73 -
 74
74 -
 75
75 -
 76
76 -
77
-
78
-
79
-
80
-
81
-
82
-
83
-
84
-
85
-
86
-
87
-
88
-
89
-
90
-
91
-
92
-
93
-
94
-
95
-
96
-
97
-
98
-
99
-
100
-
101
-
102
-
103
-
104
-
105
-
106
-
107
-
108
-
109
-
110
-
111
-
112
-
113
-
114
-
115
-
116
-
117
-
118
-
119
-
120
-
121
-
122
-
123
-
124
-
125
-
126
-
127
-
128
-
129
-
130
-
131
-
132
-
133
-
134
-
135
-
136
-
137
-
138
-
139
-
140
-
141
-
142
-
143
-
144
-
145
-
146
-
147
-
148
-
149
-
150
-
151
-
152
-
153
-
154
-
155
-
156
-
157
-
158
-
159
-
160
-
161
-
162
-
163
-
164
-
165
-
166
-
167
-
168
-
169
-
170
-
171
-
172
-
173
-
174
-
175
-
176
-
177
-
178
-
179
-
180
-
181
-
182
-
183
-
184
-
185
-
186
-
187
-
188
-
189
-
190
-
191
-
192
-
193
-
194
-
195
-
196
-
197
-
198
-
199
-
200
-
201
-
202
-
203
 |
 |

Table of Contents
comparative market data regarding executive compensation to assist the Compensation Committee in establishing reference points for the base salary, annual
incentive and long-term incentive components of our compensation package. They also provide information regarding general market trends in
compensation, compensation practices of other retail companies and regulatory and compliance developments. The fees paid to Haigh & Company for their
services in fiscal year 2014 did not exceed $120,000. Haigh & Company has no other affiliations with, and provides no other services to, us.
Ultimately, our named executive officers’ total compensation is based on the level of performance of the Company and/or the Company’s applicable
business unit or division. The Compensation Committee uses its discretion in making decisions on the overall compensation packages of our executive
officers based on current market conditions, business trends and overall Company performance.
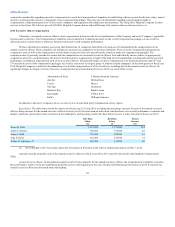
We have identified an industry peer group that includes the 14 companies listed below for purposes of benchmarking the compensation of our
named executive officers. These companies are intended to represent our competitors for business and talent. Their executive compensation programs are
compared to ours, as well as the compensation of individual executives if the jobs are sufficiently similar to make the comparison meaningful. The
comparison data is generally intended to ensure that the compensation of our named executive officers, both individually and as a whole, is appropriately
competitive relative to our performance. We believe that this practice is appropriate in light of the high level of commitment, job demands and the expected
performance contribution required from each of our executive officers. We generally target our direct compensation to be positioned between the 50th and
75th percentile levels of the compensation packages received by executives in our peer group of industry related companies. In the third quarter of fiscal year
2014, Haigh & Company conducted a benchmarking review of the compensation of all of our officers, including that of the named executive officers. No
significant changes in design or levels of executive compensation were made during fiscal year 2014 as a result of the review.
Abercrombie & Fitch L Brands (formerly Limited)
Ann Inc. Michael Kors
Coach Macy's
The Gap Nordstrom
Hudson's Bay Ralph Lauren
Kate Spade Tiffany & Co.
Kohl’s Williams-Sonoma
In addition to the select companies above, we also review various third party compensation survey reports.
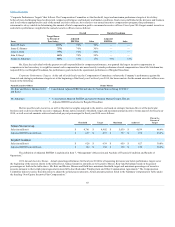
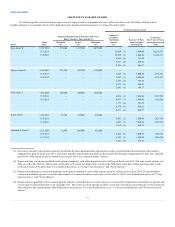
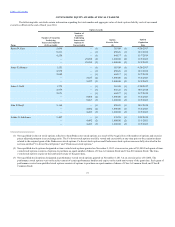
Base Salary. The table below shows the salaries for fiscal years 2013 and 2014, including the percentage increase, for each of the named executive
officers. Salary increase for the named executive officers in fiscal year 2014 were based on individual contributions to our overall performance, economic and
market conditions, general movement of salaries in the marketplace and operating results. Ms. Katz did not receive a salary increase for fiscal year 2014.
Karen W. Katz 1,070,000
1,070,000
N/A
James E. Skinner 720,000
750,000
4.2
James J. Gold 770,000
800,000
3.9
John E. Koryl 512,000
550,000
7.4
Joshua G. Schulman (1) 500,000
510,000
2.0
(1) Mr. Schulman’s 2013 base salary represents the amount of his salary at the time his employment began on May 7, 2012.
Amounts actually earned by each of the named executive officers in fiscal years 2012, 2013 and 2014 are listed in the Summary Compensation
Table.
Annual Incentive Bonus. In determining annual incentive bonus amounts for the named executive officers, the Compensation Committee considers
their performance relative to the pre-established goals that are set at the beginning of the year. The pre-established goals for fiscal year 2014 for each of our
named executive officers are discussed under the heading
64