Neiman Marcus 2013 Annual Report Download - page 46
Download and view the complete annual report
Please find page 46 of the 2013 Neiman Marcus annual report below. You can navigate through the pages in the report by either clicking on the pages listed below, or by using the keyword search tool below to find specific information within the annual report.-
 1
1 -
2
-
3
-
4
-
5
-
6
-
7
-
8
-
9
-
10
-
11
-
12
-
13
-
14
-
15
-
16
-
17
-
18
-
19
-
20
-
21
-
22
-
23
-
24
-
25
-
26
-
27
-
28
-
29
-
30
-
31
-
32
-
33
-
34
-
35
-
 36
36 -
 37
37 -
 38
38 -
 39
39 -
 40
40 -
 41
41 -
 42
42 -
 43
43 -
 44
44 -
 45
45 -
 46
46 -
 47
47 -
 48
48 -
 49
49 -
 50
50 -
 51
51 -
 52
52 -
 53
53 -
 54
54 -
 55
55 -
 56
56 -
57
-
58
-
59
-
60
-
61
-
62
-
63
-
64
-
65
-
66
-
67
-
68
-
69
-
70
-
71
-
72
-
73
-
74
-
75
-
76
-
77
-
78
-
79
-
80
-
81
-
82
-
83
-
84
-
85
-
86
-
87
-
88
-
89
-
90
-
91
-
92
-
93
-
94
-
95
-
96
-
97
-
98
-
99
-
100
-
101
-
102
-
103
-
104
-
105
-
106
-
107
-
108
-
109
-
110
-
111
-
112
-
113
-
114
-
115
-
116
-
117
-
118
-
119
-
120
-
121
-
122
-
123
-
124
-
125
-
126
-
127
-
128
-
129
-
130
-
131
-
132
-
133
-
134
-
135
-
136
-
137
-
138
-
139
-
140
-
141
-
142
-
143
-
144
-
145
-
146
-
147
-
148
-
149
-
150
-
151
-
152
-
153
-
154
-
155
-
156
-
157
-
158
-
159
-
160
-
161
-
162
-
163
-
164
-
165
-
166
-
167
-
168
-
169
-
170
-
171
-
172
-
173
-
174
-
175
-
176
-
177
-
178
-
179
-
180
-
181
-
182
-
183
-
184
-
185
-
186
-
187
-
188
-
189
-
190
-
191
-
192
-
193
-
194
-
195
-
196
-
197
-
198
-
199
-
200
-
201
-
202
-
203
 |
 |

Table of Contents
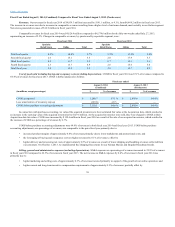
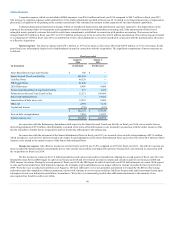
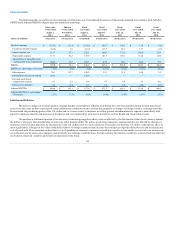
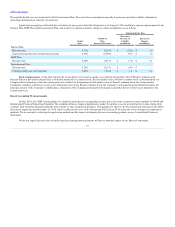
The following table reconciles net (loss) earnings as reflected in our Consolidated Statements of Operations prepared in accordance with GAAP to
EBITDA and Adjusted EBITDA (figures may not sum due to rounding):
Net (loss) earnings $ (134.1)
$ (13.1)
$ (147.2)
$ 163.7
$ 140.1
$ 31.6
$ (1.8)
Income tax (benefit) expense (89.8)
7.9
(81.9)
113.7
88.3
17.7
(3.5)
Interest expense, net 232.7
37.3
270.1
169.0
175.2
280.5
237.1
Depreciation expense 113.3
34.2
147.6
141.5
130.1
132.4
141.8
Amortization of intangible assets
and favorable lease commitments 148.6
11.7
160.3
47.4
50.1
62.5
73.3
EBITDA $ 270.8
$ 78.1
$ 348.9
$ 635.3
$ 583.8
$ 524.7
$ 446.9
EBITDA as a percentage of revenues 7.3%
6.9%
7.2%
13.7%
13.4%
13.1%
12.1%
Other expenses 76.3
113.7
190.1
23.1
11.5
10.0
9.2
Amortization of inventory step-up 129.6
—
129.6
—
—
—
—
Non-cash stock-based
compensation expense 6.3
2.5
8.8
9.7
6.9
3.9
10.1
Advisory fees and other 1.4
(1.1)
0.2
3.4
0.9
(5.2)
(5.9)
Adjusted EBITDA $ 484.4
$ 193.2
$ 677.6
$ 671.5
$ 603.1
$ 533.4
$ 460.3
Adjusted EBITDA as a percentage
of revenues 13.1%
17.1%
14.0%
14.4%
13.9%
13.3%
12.5%
We believe changes in revenues and net earnings that have resulted from inflation or deflation have not been material during the past three fiscal
years. In recent years, we have experienced certain inflationary conditions in our cost base due primarily to changes in foreign currency exchange rates that
have reduced the purchasing power of the U.S. dollar and, to a lesser extent, to increases in selling, general and administrative expenses, particularly with
regard to employee benefits, and increases in fuel prices and costs impacted by increases in fuel prices, such as freight and transportation costs.
We purchase a substantial portion of our inventory from foreign suppliers whose costs are affected by the fluctuation of their local currency against
the dollar or who price their merchandise in currencies other than the dollar. We source goods from numerous countries and thus are affected by changes in
numerous currencies and, generally, by fluctuations in the U.S. dollar relative to such currencies. Fluctuations in the Euro-U.S. dollar exchange rate affect us
most significantly. Changes in the value of the dollar relative to foreign currencies may increase the retail prices of goods offered for sale and/or increase our
cost of goods sold. If our customers reduce their levels of spending in response to increases in retail prices and/or we are unable to pass such cost increases to
our customers, our revenues, gross margins, and ultimately our earnings, could decrease. Foreign currency fluctuations could have a material adverse effect on
our business, financial condition and results of operations in the future.
44