Neiman Marcus 2013 Annual Report Download - page 136
Download and view the complete annual report
Please find page 136 of the 2013 Neiman Marcus annual report below. You can navigate through the pages in the report by either clicking on the pages listed below, or by using the keyword search tool below to find specific information within the annual report.-
 1
1 -
2
-
3
-
4
-
5
-
6
-
7
-
8
-
9
-
10
-
11
-
12
-
13
-
14
-
15
-
16
-
17
-
18
-
19
-
20
-
21
-
22
-
23
-
24
-
25
-
26
-
27
-
28
-
29
-
30
-
31
-
32
-
33
-
34
-
35
-
36
-
37
-
38
-
39
-
40
-
41
-
42
-
43
-
44
-
45
-
46
-
47
-
48
-
49
-
50
-
51
-
52
-
53
-
54
-
55
-
56
-
57
-
58
-
59
-
60
-
61
-
62
-
63
-
64
-
65
-
66
-
67
-
68
-
69
-
70
-
71
-
72
-
73
-
74
-
75
-
76
-
77
-
78
-
79
-
80
-
81
-
82
-
83
-
84
-
85
-
86
-
87
-
88
-
89
-
90
-
91
-
92
-
93
-
94
-
95
-
96
-
97
-
98
-
99
-
100
-
101
-
102
-
103
-
104
-
105
-
106
-
107
-
108
-
109
-
110
-
111
-
112
-
113
-
114
-
115
-
116
-
117
-
118
-
119
-
120
-
121
-
122
-
123
-
124
-
125
-
 126
126 -
 127
127 -
 128
128 -
 129
129 -
 130
130 -
 131
131 -
 132
132 -
 133
133 -
 134
134 -
 135
135 -
 136
136 -
 137
137 -
 138
138 -
 139
139 -
 140
140 -
 141
141 -
 142
142 -
 143
143 -
 144
144 -
 145
145 -
 146
146 -
147
-
148
-
149
-
150
-
151
-
152
-
153
-
154
-
155
-
156
-
157
-
158
-
159
-
160
-
161
-
162
-
163
-
164
-
165
-
166
-
167
-
168
-
169
-
170
-
171
-
172
-
173
-
174
-
175
-
176
-
177
-
178
-
179
-
180
-
181
-
182
-
183
-
184
-
185
-
186
-
187
-
188
-
189
-
190
-
191
-
192
-
193
-
194
-
195
-
196
-
197
-
198
-
199
-
200
-
201
-
202
-
203
 |
 |
Table of Contents
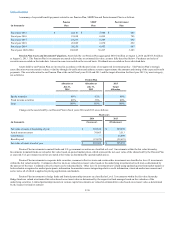
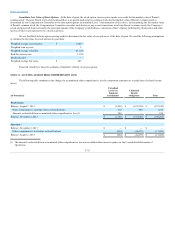
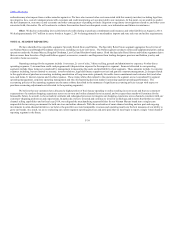
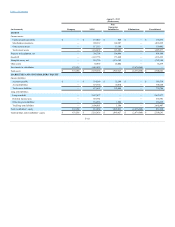
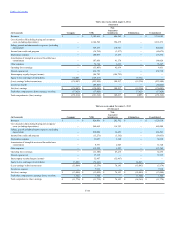
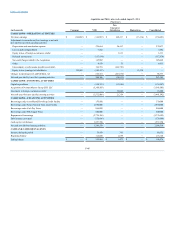
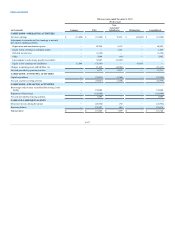
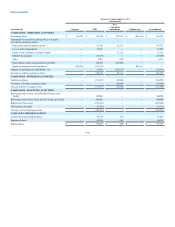
The following tables set forth the information for our reportable segments:
REVENUES
Specialty Retail Stores
$ 2,801,533
$ 889,295
$ 3,616,938
$ 3,466,628
Online
908,660
239,843
1,031,311
878,746
Total
$ 3,710,193
$ 1,129,138
$ 4,648,249
$ 4,345,374
OPERATING EARNINGS
Specialty Retail Stores
$ 288,649
$ 138,203
$ 411,435
$ 391,197
Online
126,916
33,801
157,703
132,360
Corporate expenses
(43,064)
(12,932)
(46,720)
(53,175)
Other expenses
(76,347)
(113,745)
(23,125)
(11,514)
Corporate depreciation/amortization charges
(157,688)
(13,191)
(52,906)
(55,294)
Corporate amortization of inventory step-up
(129,635)
—
—
—
Total
$ 8,831
$ 32,136
$ 446,387
$ 403,574
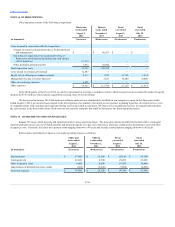
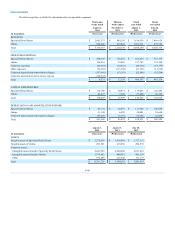
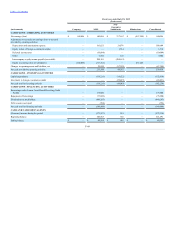
CAPITAL EXPENDITURES
Specialty Retail Stores
$ 112,780
$ 28,831
$ 119,065
$ 126,485
Online
25,227
7,128
27,440
26,353
Total
$ 138,007
$ 35,959
$ 146,505
$ 152,838
DEPRECIATION AND AMORTIZATION EXPENSE
Specialty Retail Stores
$ 83,132
$ 26,439
$ 111,964
$ 106,288
Online
21,140
6,329
24,081
18,660
Corporate depreciation/amortization charges
157,688
13,191
52,906
55,294
Total
$ 261,960
$ 45,959
$ 188,951
$ 180,242
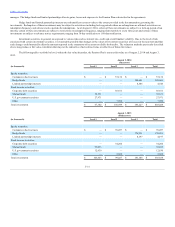
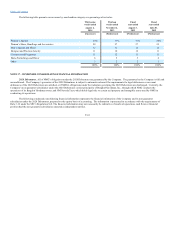
ASSETS
Tangible assets of Specialty Retail Stores
$ 2,278,036
$ 1,818,888
$ 1,777,112
Tangible assets of Online
285,581
219,230
200,553
Corporate assets:
Intangible assets related to Specialty Retail Stores
4,422,929
2,604,600
2,651,481
Intangible assets related to Online
1,378,682
440,981
441,536
Other
396,498
216,542
131,173
Total
$ 8,761,726
$ 5,300,241
$ 5,201,855
F-40