Neiman Marcus 2013 Annual Report Download - page 33
Download and view the complete annual report
Please find page 33 of the 2013 Neiman Marcus annual report below. You can navigate through the pages in the report by either clicking on the pages listed below, or by using the keyword search tool below to find specific information within the annual report.-
 1
1 -
2
-
3
-
4
-
5
-
6
-
7
-
8
-
9
-
10
-
11
-
12
-
13
-
14
-
15
-
16
-
17
-
18
-
19
-
20
-
21
-
22
-
 23
23 -
 24
24 -
 25
25 -
 26
26 -
 27
27 -
 28
28 -
 29
29 -
 30
30 -
 31
31 -
 32
32 -
 33
33 -
 34
34 -
 35
35 -
 36
36 -
 37
37 -
 38
38 -
 39
39 -
 40
40 -
 41
41 -
 42
42 -
 43
43 -
44
-
45
-
46
-
47
-
48
-
49
-
50
-
51
-
52
-
53
-
54
-
55
-
56
-
57
-
58
-
59
-
60
-
61
-
62
-
63
-
64
-
65
-
66
-
67
-
68
-
69
-
70
-
71
-
72
-
73
-
74
-
75
-
76
-
77
-
78
-
79
-
80
-
81
-
82
-
83
-
84
-
85
-
86
-
87
-
88
-
89
-
90
-
91
-
92
-
93
-
94
-
95
-
96
-
97
-
98
-
99
-
100
-
101
-
102
-
103
-
104
-
105
-
106
-
107
-
108
-
109
-
110
-
111
-
112
-
113
-
114
-
115
-
116
-
117
-
118
-
119
-
120
-
121
-
122
-
123
-
124
-
125
-
126
-
127
-
128
-
129
-
130
-
131
-
132
-
133
-
134
-
135
-
136
-
137
-
138
-
139
-
140
-
141
-
142
-
143
-
144
-
145
-
146
-
147
-
148
-
149
-
150
-
151
-
152
-
153
-
154
-
155
-
156
-
157
-
158
-
159
-
160
-
161
-
162
-
163
-
164
-
165
-
166
-
167
-
168
-
169
-
170
-
171
-
172
-
173
-
174
-
175
-
176
-
177
-
178
-
179
-
180
-
181
-
182
-
183
-
184
-
185
-
186
-
187
-
188
-
189
-
190
-
191
-
192
-
193
-
194
-
195
-
196
-
197
-
198
-
199
-
200
-
201
-
202
-
203
 |
 |

Table of Contents
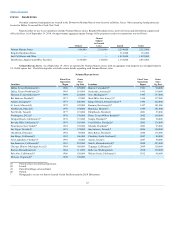
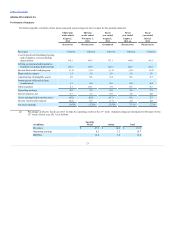
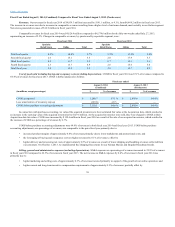
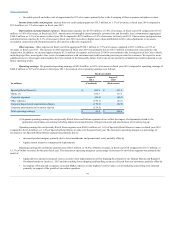
- Our operating earnings in fiscal year 2014 compared to fiscal year 2013 were:
Specialty Retail Stores
$ 426.9
$ 411.4
Online
160.7
157.7
Corporate expenses
(56.0)
(46.7)
Other expenses
(190.1)
(23.1)
Corporate depreciation/amortization charges
(170.9)
(52.9)
Corporate amortization of inventory step-up
(129.6)
—
Total operating earnings
$ 41.0
$ 446.4
Estimated operating earnings generated in the 53rd week of fiscal year 2013 were $10.7 million.
Operating earnings for our Specialty Retail Stores segment increased by 0.2% to 11.6% of Specialty Retail Stores revenues in fiscal year 2014
compared to fiscal year 2013. This increase was driven by increased product margins as a result of lower markdowns and promotional costs, net
of higher current incentive compensation costs.
For our Online segment, operating earnings decreased by 1.3% to 14.0% of Online revenues in fiscal year 2014 compared to fiscal year 2013.
This decrease was driven by 1) higher delivery and processing net costs attributable to the implementation of free shipping/free returns for our
Neiman Marcus and Bergdorf Goodman brands on October 1, 2013, partially offset by 2) increased product margins as a result of lower
markdowns and promotional costs.
We incurredother expenses of $190.1 million, or 3.9% of revenues, in fiscal year 2014. These expenses consisted primarily of costs incurred in
connection with the Acquisition and costs incurred related to the Cyber-Attack.
Corporate depreciation and amortization charges increased in fiscal year 2014 due to higher asset values attributable to fair value adjustments
to our assets recorded in connection with the purchase price allocation to reflect the Acquisition.
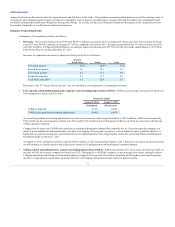
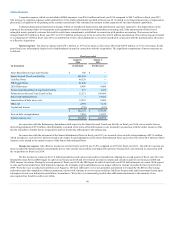
- Net cash provided by our operating activities was $295.7 million in fiscal year 2014 compared to $349.4 million in fiscal year 2013.
In connection with the Acquisition, we incurred cash payments of approximately $147.3 million to fund costs and expenses incurred as a result
of the Acquisition. We held cash balances of $196.5 million at August 2, 2014 compared to $136.7 million at August 3, 2013. At August 2,
2014, we had no borrowings outstanding under the Asset-Based Revolving Credit Facility, no outstanding letters of credit and $720.0 million
of unused borrowing availability. We believe that cash generated from our operations along with our cash balances and available sources of
financing will enable us to meet our anticipated cash obligations during the next twelve months.
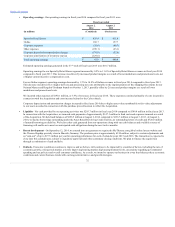
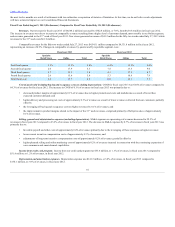
•- On September 12, 2014, we entered into an agreement to acquire the MyTheresa.com global online luxury website and
the Theresa flagship specialty store in Munich, Germany. The purchase price is approximately €150 million, subject to certain adjustments and
an "earn-out" of up to €27.5 million per year for operating performance for each of calendar years 2015 and 2016. The transaction is expected to
close later this calendar year, subject to regulatory approvals and other customary closing conditions. We plan to finance the acquisition
through a combination of cash and debt.
- Economic conditions continue to improve and we believe will continue to be impacted by a number of factors, including the rate of
economic growth, a rising stock market, a slowly improving housing market, high unemployment levels, uncertainty regarding governmental
spending and tax policies and overall consumer confidence. As a result, we intend to operate our business in a way that balances these economic
conditions and current business trends with our long-term initiatives and growth strategies.
32