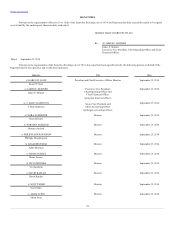
Neiman Marcus 2013 Annual Report Download - page 140
Download and view the complete annual report
Please find page 140 of the 2013 Neiman Marcus annual report below. You can navigate through the pages in the report by either clicking on the pages listed below, or by using the keyword search tool below to find specific information within the annual report.-
 1
1 -
2
-
3
-
4
-
5
-
6
-
7
-
8
-
9
-
10
-
11
-
12
-
13
-
14
-
15
-
16
-
17
-
18
-
19
-
20
-
21
-
22
-
23
-
24
-
25
-
26
-
27
-
28
-
29
-
30
-
31
-
32
-
33
-
34
-
35
-
36
-
37
-
38
-
39
-
40
-
41
-
42
-
43
-
44
-
45
-
46
-
47
-
48
-
49
-
50
-
51
-
52
-
53
-
54
-
55
-
56
-
57
-
58
-
59
-
60
-
61
-
62
-
63
-
64
-
65
-
66
-
67
-
68
-
69
-
70
-
71
-
72
-
73
-
74
-
75
-
76
-
77
-
78
-
79
-
80
-
81
-
82
-
83
-
84
-
85
-
86
-
87
-
88
-
89
-
90
-
91
-
92
-
93
-
94
-
95
-
96
-
97
-
98
-
99
-
100
-
101
-
102
-
103
-
104
-
105
-
106
-
107
-
108
-
109
-
110
-
111
-
112
-
113
-
114
-
115
-
116
-
117
-
118
-
119
-
120
-
121
-
122
-
123
-
124
-
125
-
126
-
127
-
128
-
129
-
 130
130 -
 131
131 -
 132
132 -
 133
133 -
 134
134 -
 135
135 -
 136
136 -
 137
137 -
 138
138 -
 139
139 -
 140
140 -
 141
141 -
 142
142 -
 143
143 -
 144
144 -
 145
145 -
 146
146 -
 147
147 -
 148
148 -
 149
149 -
 150
150 -
151
-
152
-
153
-
154
-
155
-
156
-
157
-
158
-
159
-
160
-
161
-
162
-
163
-
164
-
165
-
166
-
167
-
168
-
169
-
170
-
171
-
172
-
173
-
174
-
175
-
176
-
177
-
178
-
179
-
180
-
181
-
182
-
183
-
184
-
185
-
186
-
187
-
188
-
189
-
190
-
191
-
192
-
193
-
194
-
195
-
196
-
197
-
198
-
199
-
200
-
201
-
202
-
203
 |
 |
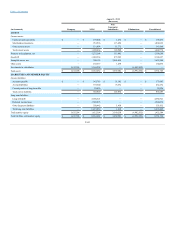
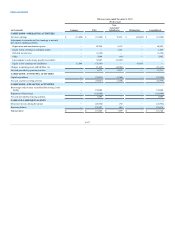
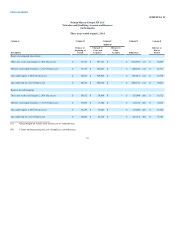
Table of Contents
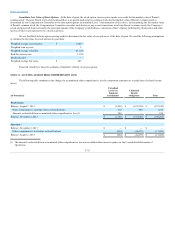
Revenues
$ —
$ 3,103,810
$ 606,383
$ —
$ 3,710,193
Cost of goods sold including buying and occupancy
costs (excluding depreciation)
—
2,164,594
398,679
—
2,563,273
Selling, general and administrative expenses (excluding
depreciation)
—
729,533
110,921
—
840,454
Income from credit card program
—
(36,795)
(3,877)
—
(40,672)
Depreciation expense
—
100,097
13,237
—
113,334
Amortization of intangible assets and favorable lease
commitments
—
107,450
41,176
—
148,626
Other expenses
—
72,734
3,613
—
76,347
Operating (loss) earnings
—
(33,803)
42,634
—
8,831
Interest expense, net
—
232,739
—
—
232,739
Intercompany royalty charges (income)
—
106,783
(106,783)
—
—
Equity in loss (earnings) of subsidiaries
134,083
(149,417)
—
15,334
—
(Loss) earnings before income taxes
(134,083)
(223,908)
149,417
(15,334)
(223,908)
Income tax benefit
—
(89,825)
—
—
(89,825)
Net (loss) earnings
$ (134,083)
$ (134,083)
$ 149,417
$ (15,334)
$ (134,083)
Total other comprehensive (loss) earnings, net of tax
(17,429)
(17,429)
—
17,429
(17,429)
Total comprehensive (loss) earnings
$ (151,512)
$ (151,512)
$ 149,417
$ 2,095
$ (151,512)
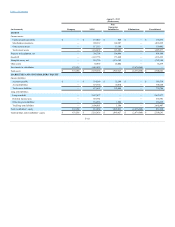
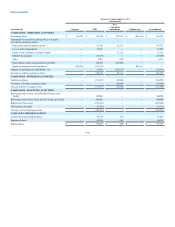
Revenues
$ —
$ 926,436
$ 202,702
$ —
$ 1,129,138
Cost of goods sold including buying and occupancy
costs (excluding depreciation)
—
568,665
116,743
—
685,408
Selling, general and administrative expenses (excluding
depreciation)
—
230,090
36,453
—
266,543
Income from credit card program
—
(13,271)
(1,382)
—
(14,653)
Depreciation expense
—
31,057
3,182
—
34,239
Amortization of intangible assets and favorable lease
commitments
—
8,773
2,947
—
11,720
Other expenses
—
112,222
1,523
—
113,745
Operating (loss) earnings
—
(11,100)
43,236
—
32,136
Interest expense, net
—
37,315
—
—
37,315
Intercompany royalty charges (income)
—
32,907
(32,907)
—
—
Equity in loss (earnings) of subsidiaries
13,098
(76,143)
—
63,045
—
(Loss) earnings before income taxes
(13,098)
(5,179)
76,143
(63,045)
(5,179)
Income tax expense
—
7,919
—
—
7,919
Net (loss) earnings
$ (13,098)
$ (13,098)
$ 76,143
$ (63,045)
$ (13,098)
Total other comprehensive earnings (loss), net of tax
1,324
1,324
—
(1,324)
1,324
Total comprehensive (loss) earnings
$ (11,774)
$ (11,774)
$ 76,143
$ (64,369)
$ (11,774)
F-44