Neiman Marcus 2013 Annual Report Download - page 43
Download and view the complete annual report
Please find page 43 of the 2013 Neiman Marcus annual report below. You can navigate through the pages in the report by either clicking on the pages listed below, or by using the keyword search tool below to find specific information within the annual report.-
 1
1 -
2
-
3
-
4
-
5
-
6
-
7
-
8
-
9
-
10
-
11
-
12
-
13
-
14
-
15
-
16
-
17
-
18
-
19
-
20
-
21
-
22
-
23
-
24
-
25
-
26
-
27
-
28
-
29
-
30
-
31
-
32
-
 33
33 -
 34
34 -
 35
35 -
 36
36 -
 37
37 -
 38
38 -
 39
39 -
 40
40 -
 41
41 -
 42
42 -
 43
43 -
 44
44 -
 45
45 -
 46
46 -
 47
47 -
 48
48 -
 49
49 -
 50
50 -
 51
51 -
 52
52 -
 53
53 -
54
-
55
-
56
-
57
-
58
-
59
-
60
-
61
-
62
-
63
-
64
-
65
-
66
-
67
-
68
-
69
-
70
-
71
-
72
-
73
-
74
-
75
-
76
-
77
-
78
-
79
-
80
-
81
-
82
-
83
-
84
-
85
-
86
-
87
-
88
-
89
-
90
-
91
-
92
-
93
-
94
-
95
-
96
-
97
-
98
-
99
-
100
-
101
-
102
-
103
-
104
-
105
-
106
-
107
-
108
-
109
-
110
-
111
-
112
-
113
-
114
-
115
-
116
-
117
-
118
-
119
-
120
-
121
-
122
-
123
-
124
-
125
-
126
-
127
-
128
-
129
-
130
-
131
-
132
-
133
-
134
-
135
-
136
-
137
-
138
-
139
-
140
-
141
-
142
-
143
-
144
-
145
-
146
-
147
-
148
-
149
-
150
-
151
-
152
-
153
-
154
-
155
-
156
-
157
-
158
-
159
-
160
-
161
-
162
-
163
-
164
-
165
-
166
-
167
-
168
-
169
-
170
-
171
-
172
-
173
-
174
-
175
-
176
-
177
-
178
-
179
-
180
-
181
-
182
-
183
-
184
-
185
-
186
-
187
-
188
-
189
-
190
-
191
-
192
-
193
-
194
-
195
-
196
-
197
-
198
-
199
-
200
-
201
-
202
-
203
 |
 |

Table of Contents
the next twelve months as a result of settlements with tax authorities or expiration of statutes of limitation. At this time, we do not believe such adjustments
will have a material impact on our Consolidated Financial Statements.
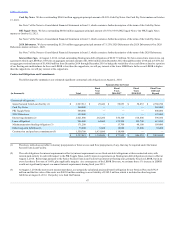
Revenues. Our revenues for fiscal year 2013 of $4,648.2 million increased by $302.8 million, or 7.0%, from $4,345.4 million in fiscal year 2012.
The increase in revenues was due to increases in comparable revenues resulting from a higher level of customer demand, most notably in our Online segment,
and revenues generated in the 53rd week of fiscal year 2013. New stores generated revenues of $41.2 million for the fifty-two weeks ended July 27, 2013 while
revenues for the 53rd week were $61.9 million.
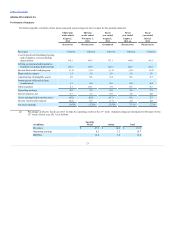
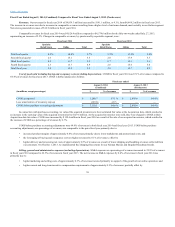
Comparable revenues for the fifty-two weeks ended July 27, 2013 were $4,545.1 million compared to $4,331.8 million in fiscal year 2012,
representing an increase of 4.9%. Changes in comparable revenues, by quarter and by reportable segment, were:
First fiscal quarter 3.5%
13.5%
5.4%
6.4%
15.2%
8.0%
Second fiscal quarter 2.0
17.9
5.3
7.8
13.5
9.0
Third fiscal quarter 0.7
15.1
3.6
4.3
17.5
6.7
Fourth fiscal quarter 2.6
15.6
5.4
5.3
18.8
7.9
Total fiscal year 2.2
15.7
4.9
6.0
16.1
7.9
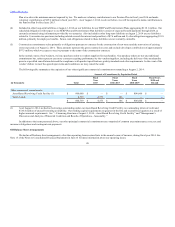
Cost of goods sold including buying and occupancy costs (excluding depreciation). COGS for fiscal year 2013 was 64.4% of revenues compared to
64.3% of revenues for fiscal year 2012. The increase in COGS of 0.1% of revenues in fiscal year 2013 was primarily due to:
• decreased product margins of approximately 0.1% of revenues due to higher promotional costs and markdowns as a result of lower than
expected customer demand; and
• higher delivery and processing net costs of approximately 0.1% of revenues as a result of lower revenues collected from our customers; partially
offset by
• the leveraging of buying and occupancy costs on higher revenues by 0.1% of revenues; and
• the improvement in product margins related to the impact of the 53rd week revenues, comprised primarily of full-price sales, of approximately
0.1% of revenues.
Selling, general and administrative expenses (excluding depreciation). SG&A expenses as a percentage of revenues decreased to 22.5% of
revenues in fiscal year 2013 compared to 23.2% of revenues in fiscal year 2012. The decrease in SG&A expenses by 0.7% of revenues in fiscal year 2013 was
primarily due to:
• favorable payroll and other costs of approximately 0.4% of revenues primarily due to the leveraging of these expenses on higher revenues;
• lower current incentive compensation costs of approximately 0.3% of revenues; and
• adjustments of long-term incentive compensation costs of approximately 0.2% of revenues; partially offset by
• higher planned selling and online marketing costs of approximately 0.2% of revenues incurred in connection with the continuing expansion of
our e-commerce and omni-channel capabilities.
Income from credit card program. Income from our credit card program was $53.4 million, or 1.1% of revenues, in fiscal year 2013 compared to
$51.6 million, or 1.2% of revenues, in fiscal year 2012.
Depreciation and amortization expenses. Depreciation expense was $141.5 million, or 3.0% of revenues, in fiscal year 2013 compared to
$130.1 million, or 3.0% of revenues, in fiscal year 2012.
41