Mazda 2011 Annual Report Download - page 73
Download and view the complete annual report
Please find page 73 of the 2011 Mazda annual report below. You can navigate through the pages in the report by either clicking on the pages listed below, or by using the keyword search tool below to find specific information within the annual report.-
 1
1 -
2
-
3
-
4
-
5
-
6
-
7
-
8
-
9
-
10
-
11
-
12
-
13
-
14
-
15
-
16
-
17
-
18
-
19
-
20
-
21
-
22
-
23
-
24
-
25
-
26
-
27
-
28
-
29
-
30
-
31
-
32
-
33
-
34
-
35
-
36
-
37
-
38
-
39
-
40
-
41
-
42
-
43
-
44
-
45
-
46
-
47
-
48
-
49
-
50
-
51
-
52
-
53
-
54
-
55
-
56
-
57
-
58
-
59
-
60
-
61
-
62
-
 63
63 -
 64
64 -
 65
65 -
 66
66 -
 67
67 -
 68
68 -
 69
69 -
 70
70 -
 71
71 -
 72
72 -
 73
73 -
 74
74 -
 75
75 -
 76
76 -
 77
77 -
 78
78 -
 79
79 -
 80
80
 |
 |

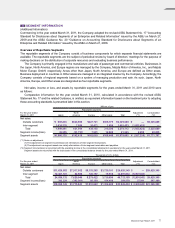
17 SEGMENT INFORMATION
(Additional Information)
Commencing in the year ended March 31, 2011, the Company adopted the revised ASBJ Statement No. 17 “Accounting
Standard for Disclosures about Segments of an Enterprise and Related Information” issued by the ASBJ on March 27,
2009 and the ASBJ Guidance No. 20 “Guidance on Accounting Standard for Disclosures about Segments of an
Enterprise and Related Information” issued by the ASBJ on March 21, 2008.
Overview of Reportable Segments
The reportable segments of the Company consist of business components for which separate financial statements are
available. The reportable segments are the subject of periodical review by board of directors’ meetings for the purpose of
making decisions on the distribution of corporate resources and evaluating business performance.
The Company is primarily engaged in the manufacture and sale of passenger and commercial vehicles. Businesses in
the Japan, North America, and Europe regions are managed by the Company, Mazda Motor of America, Inc., and Mazda
Motor Europe GmbH, respectively. Areas other than Japan, North America, and Europe are defined as Other areas.
Business deployment in countries in Other areas are managed in an integrated manner by the Company. Accordingly, the
Company consists of regional segments based on a system of managing production and sale. As such, Japan, North
America, Europe, and Other areas are designated as four reportable segments.
Net sales, income or loss, and assets by reportable segments for the years ended March 31, 2011 and 2010 were
as follows:
Comparative information for the year ended March 31, 2010, calculated in accordance with the revised ASBJ
Statement No. 17 and the related Guidance, is omitted, as equivalent information based on the treatment prior to adopting
these accounting standards is presented later in this section.
Millions of yen
Reportable segments
Adjustment
(*1)
Consolidated
(*2)
For the year ended
March 31, 2011 Japan
North
America Europe Other areas Total
Net sales:
Outside customers ¥ 965,203 ¥623,990 ¥427,721 ¥308,775 ¥2,325,689 ¥ — ¥2,325,689
Inter-segment 1,034,278 7,054 10,471 1,620 1,053,423 (1,053,423) —
Total 1,999,481 631,044 438,192 310,395 3,379,112 (1,053,423) 2,325,689
Segment income/(loss) 32,555 (31,731) 7,901 12,820 21,545 2,290 23,835
Segment assets ¥1,566,139 ¥142,415 ¥162,003 ¥108,448 ¥1,979,005 ¥ (207,238) ¥1,771,767
(*1) Notes on adjustment:
(1) The adjustment on segment income/(loss) are eliminations of inter-segment transactions.
(2) The adjustment on segment assets are mainly eliminations of inter-segment receivables and payables.
(*2) Segment income/(loss) is reconciled with the operating income in the consolidated statement of operations for the year ended March 31, 2011.
Segment assets are reconciled with the total assets in the consolidated balance sheets for the year ended March 31, 2011.
Thousands of U.S. dollars
Reportable segments
Adjustment
(*1)
Consolidated
(*2)
For the year ended
March 31, 2011 Japan
North
America Europe Other areas Total
Net sales:
Outside customers $11,628,952 $7,517,952 $5,153,265 $3,720,181 $28,020,349
$ —
$28,020,349
Inter-segment 12,461,181 84,988 126,157 19,518 12,691,843
(12,691,843)
—
Total 24,090,133 7,620,940 5,279,422 3,739,699 40,712,193
(12,691,843)
28,020,349
Segment income/(loss) 392,229 (382,301) 95,193 154,458 259,578
27,590
287,169
Segment assets $18,869,145 $1,715,843 $1,951,843 $1,306,602 $23,843,434
$ (2,496,843)
$21,346,590
Mazda Annual Report 201 1 71