Mazda 2011 Annual Report Download - page 65
Download and view the complete annual report
Please find page 65 of the 2011 Mazda annual report below. You can navigate through the pages in the report by either clicking on the pages listed below, or by using the keyword search tool below to find specific information within the annual report.-
 1
1 -
2
-
3
-
4
-
5
-
6
-
7
-
8
-
9
-
10
-
11
-
12
-
13
-
14
-
15
-
16
-
17
-
18
-
19
-
20
-
21
-
22
-
23
-
24
-
25
-
26
-
27
-
28
-
29
-
30
-
31
-
32
-
33
-
34
-
35
-
36
-
37
-
38
-
39
-
40
-
41
-
42
-
43
-
44
-
45
-
46
-
47
-
48
-
49
-
50
-
51
-
52
-
53
-
54
-
 55
55 -
 56
56 -
 57
57 -
 58
58 -
 59
59 -
 60
60 -
 61
61 -
 62
62 -
 63
63 -
 64
64 -
 65
65 -
 66
66 -
 67
67 -
 68
68 -
 69
69 -
 70
70 -
 71
71 -
 72
72 -
 73
73 -
 74
74 -
 75
75 -
76
-
77
-
78
-
79
-
80
 |
 |
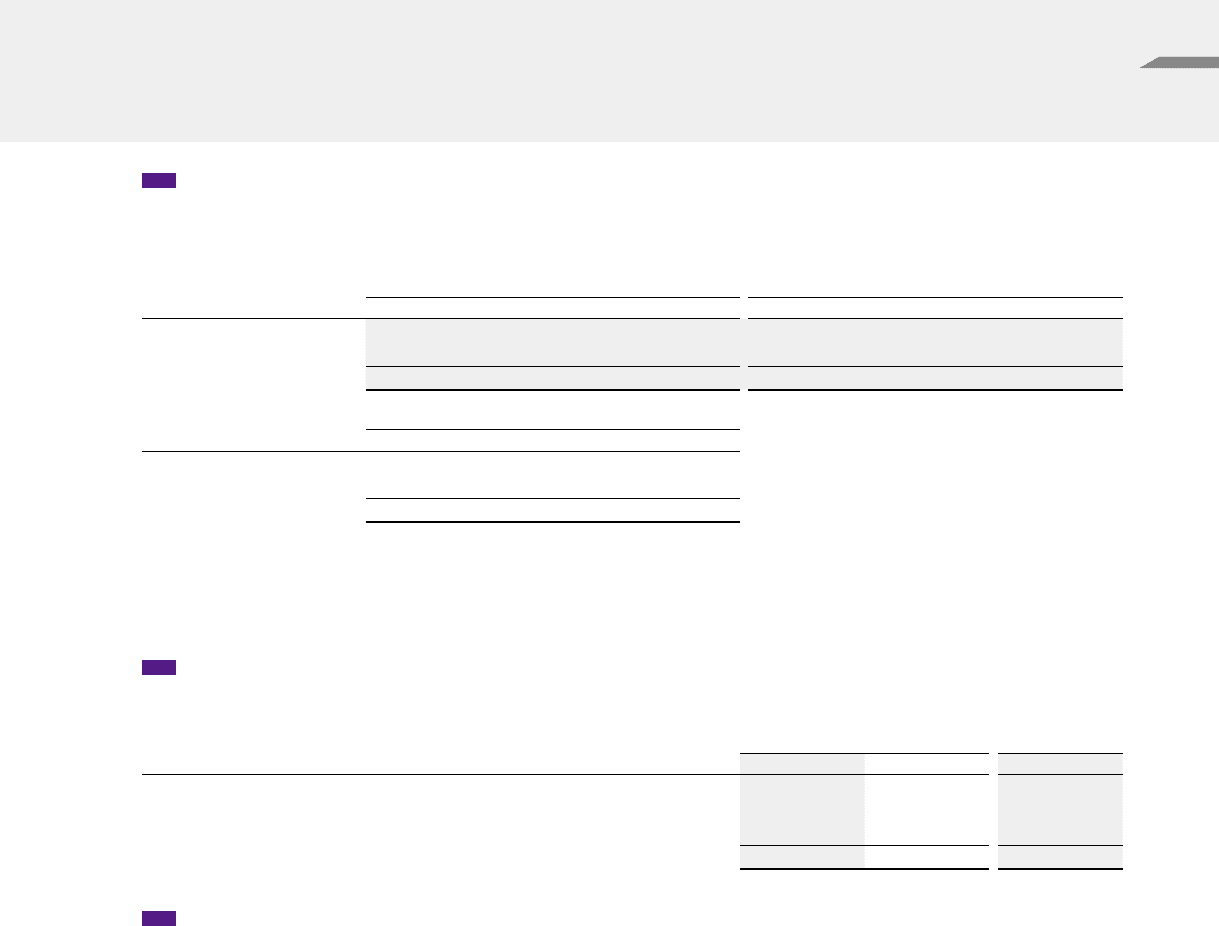
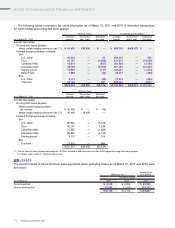
5 SECURITIES
The Company and its consolidated subsidiaries had no trading or held-to-maturity debt securities at March 31, 2011
and 2010.
Available-for-sale securities as of March 31, 2011 and 2010 were as follows:
Millions of yen Thousands of U.S. dollars
As of March 31, 2011 Acquisition costs Carrying values Difference Acquisition costs Fair values Difference
Stocks ¥ 4,523 ¥ 4,269 ¥(254) $ 54,494 $ 51,434 $(3,060)
Other 154,075 154,075 — 1,856,325 1,856,325 —
¥158,598 ¥158,344 ¥(254) $1,910,819 $1,907,759 $(3,060)
Millions of yen
As of March 31, 2010 Acquisition costs Carrying values Difference
Stocks ¥ 4,446 ¥ 4,686 ¥240
Other 95,776 95,776 —
¥100,222 ¥100,462 ¥240
In addition to the securities shown in the above tables, as of March 31, 2011 and 2010, there were unlisted equity
securities with carrying values of ¥3,251 million ($39,169 thousand) and ¥3,186 million, respectively, which also fall
in the category of available-for-sale securities. However, these securities were excluded from the above tables since
their market values cannot be estimated.
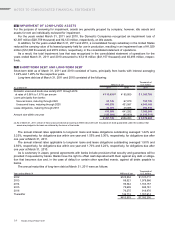
6 INVENTORIES
Inventories as of March 31, 2011 and 2010 were as follows:
Millions of yen
Thousands of
U.S. dollars
As of March 31 2011 2010 2011
Finished products ¥141,959 ¥157,745 $1,710,349
Work in process 42,842 42,341 516,169
Raw materials and supplies 12,210 10,786 147,108
¥197,011 ¥210,872 $2,373,627
7 LAND REVALUATION
As of March 31, 2001, in accordance with the Law to Partially Revise the Land Revaluation Law (Law No.19,
enacted on March 31, 2001), land owned by the Company for business use was revalued. The unrealized gains on
the revaluation are included in equity as “Land revaluation,” net of deferred taxes. The deferred taxes on the unreal-
ized gains are included in liabilities as “Deferred tax liability related to land revaluation.”
The fair value of land was determined based on official notice prices that are assessed and published by the
Commissioner of the National Tax Administration, as stipulated in Article 2-4 of the Ordinance Implementing the Law
Concerning Land Revaluation (Article 119 of 1998 Cabinet Order, promulgated on March 31, 1998). Reasonable
adjustments, including those for the timing of assessment, are made to the official notice prices.
The amounts of decrease in the aggregate fair value of the revalued land as of March 31, 2011 and 2010 from
that at the time of revaluation, as stipulated in Article 10 of the Land Revaluation Law, were ¥95,099 million
($1,145,771 thousand) and ¥87,836 million, respectively.
Mazda Annual Report 201 1 63