Mazda 2011 Annual Report Download - page 4
Download and view the complete annual report
Please find page 4 of the 2011 Mazda annual report below. You can navigate through the pages in the report by either clicking on the pages listed below, or by using the keyword search tool below to find specific information within the annual report.-
 1
1 -
 2
2 -
 3
3 -
 4
4 -
 5
5 -
 6
6 -
 7
7 -
 8
8 -
 9
9 -
 10
10 -
 11
11 -
 12
12 -
 13
13 -
 14
14 -
 15
15 -
16
-
17
-
18
-
19
-
20
-
21
-
22
-
23
-
24
-
25
-
26
-
27
-
28
-
29
-
30
-
31
-
32
-
33
-
34
-
35
-
36
-
37
-
38
-
39
-
40
-
41
-
42
-
43
-
44
-
45
-
46
-
47
-
48
-
49
-
50
-
51
-
52
-
53
-
54
-
55
-
56
-
57
-
58
-
59
-
60
-
61
-
62
-
63
-
64
-
65
-
66
-
67
-
68
-
69
-
70
-
71
-
72
-
73
-
74
-
75
-
76
-
77
-
78
-
79
-
80
 |
 |

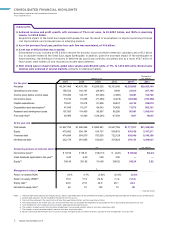
CONSOLIDATED FINANCIAL HIGHLIGHTS
Mazda Motor Corporation and Consolidated Subsidiaries
Years ended March 31
Millions of yen
Thousands of
U.S. dollars*1
For the year 2007 2008 2009 2010 2011*8 2011
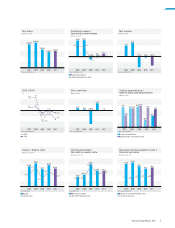
Net sales ¥3,247,485 ¥3,475,789 ¥2,535,902 ¥2,163,949 ¥2,325,689 $28,020,349
Operating income (loss) 158,532 162,147 (28,381) 9,458 23,835 287,168
Income (loss) before income taxes 118,450 143,117 (51,339) (7,265) 16,081 193,746
Net income (loss) 73,744 91,835 (71,489) (6,478) (60,042) (723,398)
Capital expenditures 79,641 75,518 81,838 29,837 44,722 538,819
Depreciation and amortization*247,045 74,217 84,043 76,428 71,576 862,361
Research and development costs 107,553 114,400 95,967 85,206 90,961 1,095,916
Free cash ow*320,995 10,209 (129,244) 67,394 1,627 19,603
At the year-end
Total assets ¥1,907,752 ¥1,985,566 ¥1,800,981 ¥1,947,769 ¥1,771,767 $21,346,590
Equity 479,882 554,154 414,731 509,815 430,539 5,187,217
Financial debt 474,684 504,979 753,355 722,128 693,000 8,349,398
Net nancial debt 232,179 281,085 532,631 375,825 370,151 4,459,651
Yen U.S. dollars*1
Amounts per share of common stock
Net income (loss)*4¥ 52.59 ¥ 65.21 ¥ (52.13) ¥ (4.26) ¥ (33.92) $(0.41)
Cash dividends applicable to the year*56.00 6.00 3.00 3.00 — —
Equity*6336.45 391.82 314.98 286.92 242.24 2.92
%
Management indexes
Return on assets (ROA) 4.0% 4.7% (3.8)% (0.3)% (3.2)%
Return on equity (ROE)*716.9 17.9 (14.8) (1.4) (12.8)
Equity ratio*724.8 27.8 22.9 26.1 24.2
Net debt-to-equity ratio*749 51 129 74 86
Notes: 1. The translation of the Japanese yen amounts into U.S. dollars is presented solely for the convenience of readers, using the prevailing exchange rate on March 31, 201 1, of ¥83 to US$1.
2. Amortization expenses are not included for the March 2007 fiscal year.
3. Free cash flow represents the sum of net cash flows from operating activities and from investing activities.
4. The computations of net income (loss) per share of common stock are based on the weighted-average number of shares outstanding during each fiscal year.
5. Cash dividends per share represent actual amounts applicable to the respective year.
6. The amounts of equity used in the calculation of equity per share exclude minority interests and stock acquisition rights.
7. The amounts of equity exclude minority interests and stock acquisition rights.
8. Results information for the March 201 1 fiscal year includes 15-month results for certain overseas subsidiaries that changed their fiscal year-end.
( ) indicates minus
HIGHLIGHTS
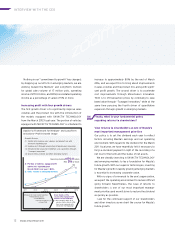
Achieved revenue and profit growth, with increases of 7% in net sales, to ¥2,325.7 billion, and 152% in operating
income, to ¥23.8 billion.
Despite the impact of the Great East Japan Earthquake, this was the result of an emphasis on improving earnings through
cost improvements and increased sales in emerging markets.
As in the previous fiscal year, positive free cash flow was maintained, at ¥1.6 billion.
A net loss of ¥60.0 billion was recorded.
Extraordinary losses included an ¥8.5 billion reserve for business losses at a North American subsidiary and a ¥5.2 billion
loss on disaster related to the Great East Japan Earthquake. In addition, given the uncertain impact of the earthquake on
future earnings, the likelihood of recovery of deferred tax assets was carefully considered, and as a result ¥56.7 billion of
those assets were written off and recorded as income taxes–deferred.
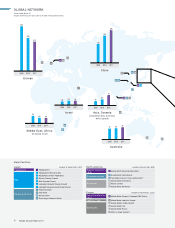
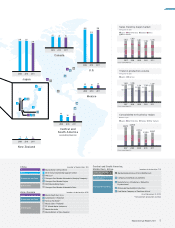
With strong sales in major markets, global sales volume grew 80,000 units, or 7%, to 1,273,000 units. Record sales
volumes were achieved in several markets, primarily in emerging markets.
2 Mazda Annual Report 201 1