Mazda 2011 Annual Report Download - page 44
Download and view the complete annual report
Please find page 44 of the 2011 Mazda annual report below. You can navigate through the pages in the report by either clicking on the pages listed below, or by using the keyword search tool below to find specific information within the annual report.-
 1
1 -
2
-
3
-
4
-
5
-
6
-
7
-
8
-
9
-
10
-
11
-
12
-
13
-
14
-
15
-
16
-
17
-
18
-
19
-
20
-
21
-
22
-
23
-
24
-
25
-
26
-
27
-
28
-
29
-
30
-
31
-
32
-
33
-
 34
34 -
 35
35 -
 36
36 -
 37
37 -
 38
38 -
 39
39 -
 40
40 -
 41
41 -
 42
42 -
 43
43 -
 44
44 -
 45
45 -
 46
46 -
 47
47 -
 48
48 -
 49
49 -
 50
50 -
 51
51 -
 52
52 -
 53
53 -
 54
54 -
55
-
56
-
57
-
58
-
59
-
60
-
61
-
62
-
63
-
64
-
65
-
66
-
67
-
68
-
69
-
70
-
71
-
72
-
73
-
74
-
75
-
76
-
77
-
78
-
79
-
80
 |
 |
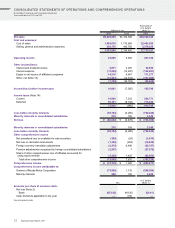
(Net Income)
Net other expenses were ¥7.8 billion. This included losses on
disaster from the Great East Japan Earthquake, and a provision
for business losses at an affiliated company in North America.
This resulted in income before income taxes of ¥16.1 billion,
compared with a ¥7.3 billion loss in the previous year.
The net loss for the year was ¥60.0 billion, compared with a
year-earlier loss of ¥6.5 billion, with the net loss for the current
year including a ¥56.7 billion write-off of deferred tax assets.
The net loss per share of common stock was ¥33.92, compared
with the previous year’s ¥4.26 net loss per share.
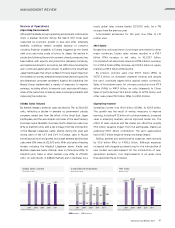
(Segment Results)
Japan
Net sales rose ¥132.2 billion (7%) from the previous year, to
¥1,999.5 billion, and segment profit (operating income) grew
¥1.8 billion (6%), to ¥32.6 billion. This growth was the result of
an increase in overseas vehicle shipments and measures to
improve earnings, despite the effect of the Great East Japan
Earthquake.
North America
Net sales rose ¥59.0 billion (10%), to ¥631.0 billion, but the
segment loss (operating loss) grew ¥12.4 billion, to ¥31.7 billion.
Although sales grew on an increase in vehicle shipments, this
result reflected the yen’s appreciation.
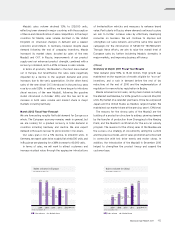
Europe
Net sales declined ¥50.5 billion (10%), to ¥438.2 billion, but
segment profit (operating income) grew ¥4.4 billion (125%), to
¥7.9 billion. Despite lower vehicle shipments and the yen’s
appreciation, an improved model mix and fixed cost reductions
contributed to profit growth.
Other Markets
Net sales rose ¥85.2 billion (38%), to ¥310.4 billion, and
segment profit (operating income) grew ¥7.4 billion (138%), to
¥12.8 billion, mainly from an increase in vehicle shipments.
(Capital Expenditures)
Capital expenditures for the year grew ¥14.9 billion, to ¥44.7
billion. The majority of this amount was for manufacturing
equipment for new models, which led to streamlining of production
and more-efficient use of labor at the Hiroshima and Hofu plants,
as well as for equipment for research and development for new
products and technologies. Overseas expenditures were primarily
investments for lease assets, and software.
Depreciation and amortization expenses declined ¥4.9
billion, to ¥71.6 billion.
(Research and Development)
Research and development costs increased ¥5.8 billion from
the March 2010 fiscal year, to ¥91.0 billion.
An overview of Mazda’s new-generation SKYACTIV
TECHNOLOGY, and its core technologies of engines, trans-
missions, bodies, and chassis, was announced in October 2010.
In the first use of this new technology, a new Demio was
released in Japan in June 201 1, equipped with the SKYACTIV-G
new-generation direct-injection gasoline engine, which
significantly increases combustion efficiency to achieve fuel
economy of 30km/L (10-15 mode) without the assistance of
an electric motor. Based on our Sustainable Zoom-Zoom
long-term vision for technology development, Mazda aims to
raise the average fuel economy of all its cars sold globally by
at least 30% from the 2008 level by 2015, to provide
customers with driving pleasure and outstanding environ-
mental and safety performance.
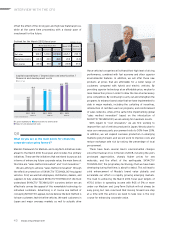
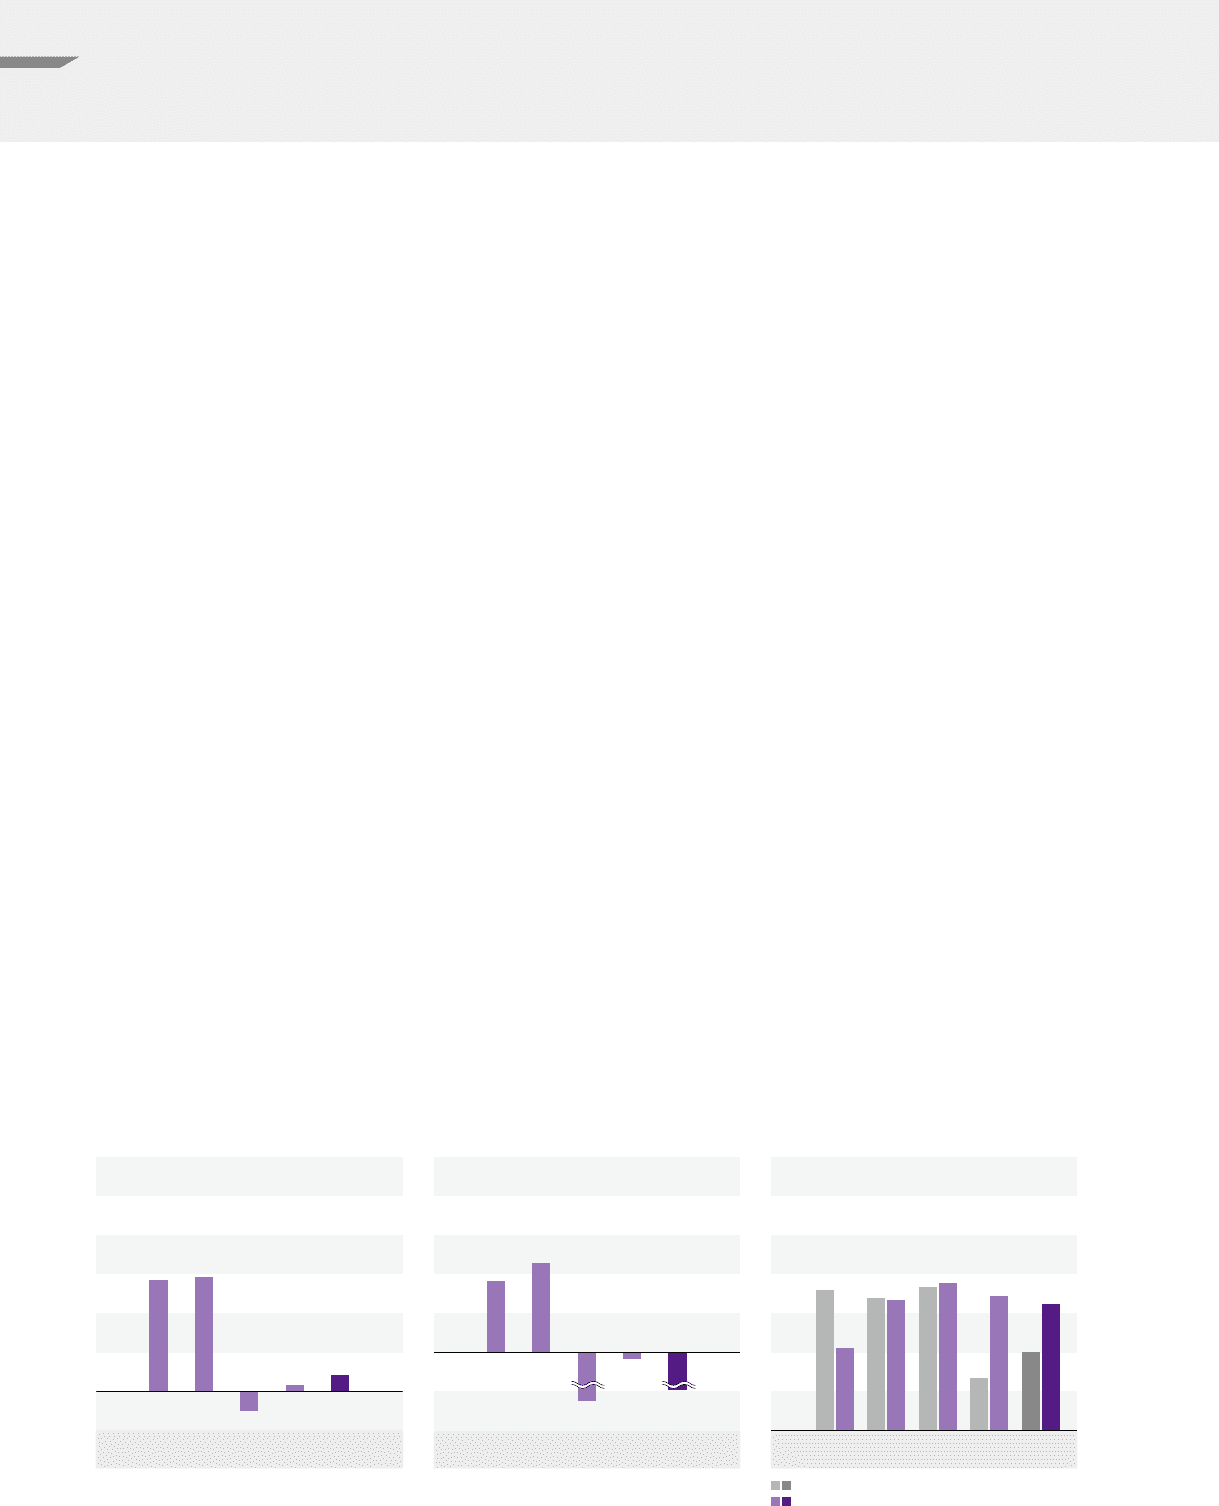
2007 2008 2009 2010 2011
158.5 162.1
(28.4) 9.5 23.8
Operating income
Billions of yen
(Years ended March 31)
2007 2008 2009 2010 2011
73.7
91.8
(71.5) (6.5) (60.0)
Net income
Billions of yen
(Years ended March 31)
2007 2008 2009 2010 2011
79.6
47.0
75.5 74.2
81.8 84.0
29.8
76.4
44.7
71.6
Capital expenditures /
Depreciation and amortization
Billions of yen
(Years ended March 31)
Capital expenditures
Depreciation and amortization
MANAGEMENT REVIEW
42 Mazda Annual Report 201 1