Mazda 2011 Annual Report Download - page 50
Download and view the complete annual report
Please find page 50 of the 2011 Mazda annual report below. You can navigate through the pages in the report by either clicking on the pages listed below, or by using the keyword search tool below to find specific information within the annual report.-
 1
1 -
2
-
3
-
4
-
5
-
6
-
7
-
8
-
9
-
10
-
11
-
12
-
13
-
14
-
15
-
16
-
17
-
18
-
19
-
20
-
21
-
22
-
23
-
24
-
25
-
26
-
27
-
28
-
29
-
30
-
31
-
32
-
33
-
34
-
35
-
36
-
37
-
38
-
39
-
 40
40 -
 41
41 -
 42
42 -
 43
43 -
 44
44 -
 45
45 -
 46
46 -
 47
47 -
 48
48 -
 49
49 -
 50
50 -
 51
51 -
 52
52 -
 53
53 -
 54
54 -
 55
55 -
 56
56 -
 57
57 -
 58
58 -
 59
59 -
 60
60 -
61
-
62
-
63
-
64
-
65
-
66
-
67
-
68
-
69
-
70
-
71
-
72
-
73
-
74
-
75
-
76
-
77
-
78
-
79
-
80
 |
 |

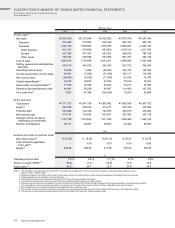
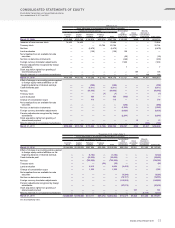
ELEVEN-YEAR SUMMARY OF CONSOLIDATED FINANCIAL STATEMENTS
Mazda Motor Corporation and Consolidated Subsidiaries
Years ended March 31
Millions of yen Millions of yen
Thousands of
U.S. dollars*1
2011 2010 2009 2008 2007 2006 2005 2004 2003 2002 2001 2011
For the year*2:
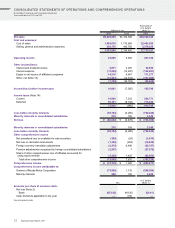
Net sales ¥2,325,689 ¥2,163,949 ¥2,535,902 ¥3,475,789 ¥3,247,485 ¥2,919,823 ¥2,695,564 ¥2,916,130 ¥2,364,512 ¥2,094,914 ¥2,015,812 $28,020,349
Domestic 541,490 574,982 620,336 880,132 887,327 887,662 845,620 846,231 818,271 811,050 911,968 6,523,976
Overseas 1,784,199 1,588,967 1,915,566 2,595,657 2,360,158 2,032,161 1,849,944 2,069,899 1,546,241 1,283,864 1,103,844 21,496,373
North America 631,327 574,640 697,600 1,015,315 1,017,874 843,988 761,684 936,718 845,241 776,889 618,076 7,606,349
Europe 427,398 477,337 653,382 888,555 789,135 668,941 634,233 659,813 368,045 228,120 236,324 5,149,373
Other areas 725,474 536,990 564,584 691,787 553,149 519,232 454,027 473,368 332,955 278,855 249,444 8,740,651
Cost of sales 1,863,678 1,710,699 2,021,851 2,485,905 2,322,644 2,110,934 1,972,574 2,165,160 1,725,058 1,551,410 1,555,130 22,453,952
Selling, general and administrative
expenses 438,176 443,792 542,432 827,737 766,309 685,454 640,043 680,796 588,798 514,951 475,619 5,279,229
Operating income (loss) 23,835 9,458 (28,381) 162,147 158,532 123,435 82,947 70,174 50,656 28,553 (14,937) 287,168
Income (loss) before income taxes 16,081 (7,265) (51,339) 143,117 118,450 117,468 73,847 54,072 28,134 15,508 (242,442) 193,746
Net income (loss) (60,042) (6,478) (71,489) 91,835 73,744 66,711 45,772 33,901 24,134 8,830 (155,243) (723,398)
Capital expenditures*344,722 29,837 81,838 75,518 79,641 72,070 67,881 45,644 44,080 56,641 47,285 538,819
Depreciation and amortization*471,576 76,428 84,043 74,217 47,045 45,805 40,036 37,900 36,989 44,890 49,531 862,361
Research and development costs 90,961 85,206 95,967 114,400 107,553 95,730 90,841 87,807 87,800 94,964 83,617 1,095,916
Free cash flow*51,627 67,394 (129,244) 10,209 20,995 33,611 35,900 49,128 47,054 30,623 52,257 19,603
At the year-end:
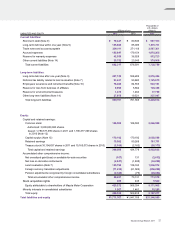
Total assets ¥1,771,767 ¥1,947,769 ¥1,800,981 ¥1,985,566 ¥1,907,752 ¥1,788,659 ¥1,767,846 ¥1,795,573 ¥1,754,017 ¥1,734,895 ¥1,743,627 $21,346,590
Equity*6430,539 509,815 414,731 554,154 479,882 407,208 275,841 230,937 200,546 180,892 166,123 5,187,217
Financial debt 693,000 722,128 753,355 504,979 474,684 455,409 528,145 630,360 678,205 686,318 777,292 8,349,398
Net financial debt 370,151 375,825 532,631 281,085 232,179 246,751 313,506 358,129 403,483 456,874 484,677 4,459,651
Average number of shares
outstanding (in thousands) 1,770,198 1,519,652 1,371,456 1,408,368 1,402,315 1,294,533 1,216,245 1,217,692 1,219,050 1,221,750 1,222,495
Number of employees 38,117 38,987 39,852 39,364 38,004 36,626 35,680 35,627 36,184 37,824 39,601
Yen Yen U.S. dollars*1
Amounts per share of common stock:
Net income (loss)*7¥ (33.92) ¥ (4.26) ¥ (52.13) ¥ 65.21 ¥ 52.59 ¥ 51.53 ¥ 37.63 ¥ 27.84 ¥ 19.80 ¥ 7.23 ¥(126.99) $(0.41)
Cash dividends applicable
to the year*8—3.00 3.00 6.00 6.00 5.00 3.00 2.00 2.00 2.00 — —
Equity*9242.24 286.92 314.98 391.82 336.45 284.28 220.22 182.91 159.22 141.52 129.96 2.92
% %
Operating income ratio 1.0 % 0.4 % (1.1)% 4.7% 4.9% 4.2% 3.1% 2.4% 2.1% 1.4% (0.7)%
Return on equity (ROE)*10 (12.8) (1.4) (14.8) 17.9 16.9 20.0 18.7 16.3 13.2 5.3 (76.7)
Equity ratio*10 24.2 26.1 22.9 27.8 24.8 22.3 15.1 12.4 11.1 10.0 9.1
Notes: 1. The translation of the Japanese yen amounts into U.S. dollars is presented solely for the convenience of readers, using the prevailing exchange rate on
March 31, 2011, of ¥83 to US$1.
2. Results information for the March 2004 and 2011 fiscal years include 15-month results for certain overseas subsidiaries that changed their fiscal year-end.
3. Capital expenditures are calculated on an accrual basis.
4. Amortization expenses are not included for the March 2007 fiscal year and preceding fiscal years.
5. Free cash flow represents the sum of net cash flows from operating activities and from investing activities.
6. Prior-year amounts have been reclassified to conform to figures for the March 2007 fiscal year and subsequent fiscal years presentation to include minority interests.
7. The computations of net income (loss) per share of common stock are based on the average number of shares outstanding during each fiscal year.
8. Cash dividends per share represent actual amounts applicable to the respective years.
9. The amounts of equity used in the calculation of equity per share exclude minority interests (and, from the March 2007 fiscal year, stock acquisition rights).
10. The amounts of equity exclude minority interests (and, from the March 2007 fiscal year, stock acquisition rights).
48 Mazda Annual Report 201 1