Mazda 2011 Annual Report Download - page 56
Download and view the complete annual report
Please find page 56 of the 2011 Mazda annual report below. You can navigate through the pages in the report by either clicking on the pages listed below, or by using the keyword search tool below to find specific information within the annual report.-
 1
1 -
2
-
3
-
4
-
5
-
6
-
7
-
8
-
9
-
10
-
11
-
12
-
13
-
14
-
15
-
16
-
17
-
18
-
19
-
20
-
21
-
22
-
23
-
24
-
25
-
26
-
27
-
28
-
29
-
30
-
31
-
32
-
33
-
34
-
35
-
36
-
37
-
38
-
39
-
40
-
41
-
42
-
43
-
44
-
45
-
 46
46 -
 47
47 -
 48
48 -
 49
49 -
 50
50 -
 51
51 -
 52
52 -
 53
53 -
 54
54 -
 55
55 -
 56
56 -
 57
57 -
 58
58 -
 59
59 -
 60
60 -
 61
61 -
 62
62 -
 63
63 -
 64
64 -
 65
65 -
 66
66 -
67
-
68
-
69
-
70
-
71
-
72
-
73
-
74
-
75
-
76
-
77
-
78
-
79
-
80
 |
 |

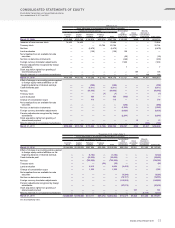
CONSOLIDATED STATEMENTS OF CASH FLOWS
Mazda Motor Corporation and Consolidated Subsidiaries
Years ended March 31, 201 1 and 2010
Millions of yen
Thousands of
U.S. dollars
(Note 1)
2011 2010 2011
Cash flows from operating activities:
Income/(loss) before income taxes ¥ 16,081 ¥ (7,265) $ 193,746
Adjustments to reconcile income/(loss) before
income taxes to net cash provided by/(used in) operating activities:
Depreciation and amortization 71,576 76,428 862,361
Loss on impairment of fixed assets 3,416 2,495 41,157
Adoption of accounting standards for asset retirement obligations 2,684 — 32,337
Allowance for doubtful receivables (469) (457) (5,651)
Investment valuation allowance (262) (225) (3,157)
Reserve for warranty expenses 5,627 (1,060) 67,795
Employees’ severance and retirement benefits (6,074) (5,815) (73,181)
Reserve for loss from business of affiliates 4,136 5,862 49,831
Reserve for environmental measures 10 1,464 120
Interest and dividend income (2,071) (2,076) (24,952)
Interest expense 11,840 13,947 142,651
Equity in net loss/(income) of affiliated companies (14,216) (8,667) (171,277)
Loss on sale/disposition of property, plant and equipment, net 1,908 3,012 22,988
Gain on sale of investment securities, net (11) (3) (133)
Gain on sale of investments in affiliates (702) (440) (8,458)
Decrease/(increase) in trade notes and accounts receivable 20,679 (35,431) 249,145
Decrease in inventories 4,763 16,230 57,386
Increase/(decrease) in trade notes and accounts payable (61,124) 94,467 (736,434)
Decrease in other current liabilities (10,262) (4,857) (123,639)
Other (8,947) (22,077) (107,792)
Subtotal 38,582 125,532 464,843
Interest and dividends received 5,351 4,334 64,470
Interest paid (11,986) (13,834) (144,410)
Income taxes paid (16,603) (4,386) (200,036)
Net cash provided by/(used in) operating activities 15,344 111,646 184,867
Cash flows from investing activities:
Payments into time deposits (10,001) — (120,494)
Proceeds from withdrawal of time deposits 10,013 — 120,639
Purchase of short-term investments — (20,000) —
Proceeds from sales and redemption of securities 20,000 — 240,964
Purchase of investment securities (1,229) (4,731) (14,807)
Proceeds from sales and redemption of investment securities 191 20 2,301
Acquisition of property, plant and equipment (32,249) (20,718) (388,542)
Proceeds from sale of property, plant and equipment 2,758 4,229 33,229
Acquisition of intangible assets (4,946) (4,314) (59,590)
Decrease/(increase) in short-term loans receivable 4932 48
Long-term loans receivable made (330) (141) (3,976)
Collections of long-term loans receivable 406 270 4,892
Sale of investments in subsidiaries affecting scope of consolidation 1,691 204 20,373
Other (25) (3) (301)
Net cash used in investing activities (13,717) (44,252) (165,264)
Cash flows from financing activities:
Increase/(decrease) in short-term debt 1,605 (47,389) 19,337
Proceeds from long-term debt 114,169 80,883 1,375,530
Repayment of long-term debt (123,826) (66,158) (1,491,880)
Proceeds from issuance of common stock — 73,537 —
Cash dividends paid (5,311) —(63,988)
Cash dividends paid to the minority shareholders of consolidated subsidiaries (458) (2) (5,518)
Treasury stock transactions (7) 19,765 (84)
Other (532) 315 (6,409)
Net cash provided by/(used in) financing activities (14,360) 60,951 (173,012)
Effect of exchange rate fluctuations on cash and cash equivalents (10,721) (2,766) (129,169)
Net increase/(decrease) in cash and cash equivalents (23,454) 125,579 (282,578)
Cash and cash equivalents at beginning of the year 346,303 220,724 4,172,325
Cash and cash equivalents at end of the year ¥322,849 ¥346,303 $ 3,889,747
See accompanying notes.
54 Mazda Annual Report 201 1