Mazda 2011 Annual Report Download - page 49
Download and view the complete annual report
Please find page 49 of the 2011 Mazda annual report below. You can navigate through the pages in the report by either clicking on the pages listed below, or by using the keyword search tool below to find specific information within the annual report.-
 1
1 -
2
-
3
-
4
-
5
-
6
-
7
-
8
-
9
-
10
-
11
-
12
-
13
-
14
-
15
-
16
-
17
-
18
-
19
-
20
-
21
-
22
-
23
-
24
-
25
-
26
-
27
-
28
-
29
-
30
-
31
-
32
-
33
-
34
-
35
-
36
-
37
-
38
-
 39
39 -
 40
40 -
 41
41 -
 42
42 -
 43
43 -
 44
44 -
 45
45 -
 46
46 -
 47
47 -
 48
48 -
 49
49 -
 50
50 -
 51
51 -
 52
52 -
 53
53 -
 54
54 -
 55
55 -
 56
56 -
 57
57 -
 58
58 -
 59
59 -
60
-
61
-
62
-
63
-
64
-
65
-
66
-
67
-
68
-
69
-
70
-
71
-
72
-
73
-
74
-
75
-
76
-
77
-
78
-
79
-
80
 |
 |

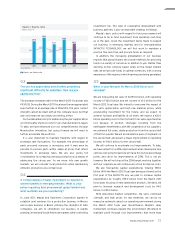
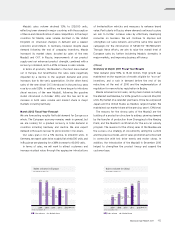
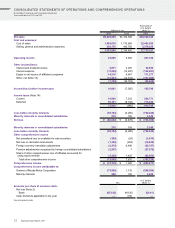
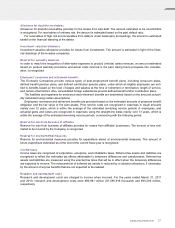
Financial Position
Total assets as of March 31, 201 1, stood at ¥1,771.8 billion. This
represented a ¥176.0 billion decline from the end of the
previous fiscal year, reflecting a decrease in cash and deposits
from the repayment of borrowings, and a partial write-off of
deferred tax assets. Cash and cash equivalents decreased
¥23.5 billion, to ¥322.8 billion. Inventories were reduced ¥13.9
billion, to ¥197.0 billion. Net property, plant and equipment
decreased ¥39.4 billion, to ¥786.2 billion.
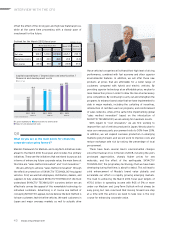
Total short- and long-term interest-bearing debt decreased
¥29.1 billion, to ¥693.0 billion, from the repayment of
borrowings and a reduction in lease obligations. Net interest-
bearing debt—interest-bearing debt minus the ¥322.8 billion of
cash and cash equivalents—decreased ¥5.7 billion, to ¥370.2
billion, and the net debt-to-equity ratio stood at 86%. Total
liabilities at the fiscal year-end stood at ¥1,341.2 billion, which
was ¥96.7 billion less than at the end of the previous fiscal
year, on a decrease in trade notes and accounts payable
associated with the decline in production volume from the
Great East Japan Earthquake.
With the recording of a net loss for the year, equity decreased
¥79.3 billion, to ¥430.5 billion as of the fiscal year-end. Equity
per share decreased ¥44.68, to ¥242.24, from ¥286.92 at the
end of the previous fiscal year. Equity used for the calculation
of the equity ratio (i.e., equity less minority interests and stock
acquisition rights) decreased ¥79.1 billion, to ¥428.8 billion, for a
1.9 percentage point decline in the equity ratio, to 24.2%.
Cash Flows
(Cash Flow from Operating Activities)
Operating activities during the year generated net cash in the
amount of ¥15.3 billion. Income before income taxes was ¥16.1
billion, while depreciation and amortization totaled ¥71.6
billion, and the decline in production at domestic plants from
the impact of the Great East Japan Earthquake reduced trade
notes and accounts payable by ¥61.1 billion.
(Cash Flow from Investing Activities)
Investing activities used net cash in the amount of ¥13.7 billion,
the main item being outlays of ¥32.2 billion for the acquisition
of property, plant and equipment.
(Cash Flow from Financing Activities)
Financing activities used net cash in the amount of ¥14.4
billion, with the repayment of interest-bearing debt and the
previous fiscal year-end’s dividend payment exceeding the
amount of funds procured through corporate bonds and long-
term borrowings.
Free cash flow—the sum of operating cash flow and investing
cash flow—was positive in the amount of ¥1.6 billion.
Fund procurement consisted of ¥91.8 billion of long-term
borrowings during the year, and a ¥20.0 billion corporate bond
issue in January 201 1.
2007 2008 2009 2010 2011
1,907.8
479.9
1,985.6
554.2
414.7 509.8 430.5
24.8 27.8
22.9
1,801.0
1,947.8
1,771.8
26.1 24.2
Total assets / Equity / Equity ratio
Billions of yen / %
(As of March 31)
2007 2008 2009 2010 2011
474.7
232.2
505.0
281.1
532.6
375.8 370.2
753.4 722.1 693.0
Financial debt / Net financial debt
Billions of yen
(As of March 31)
2007 2008 2009 2010 2011
116.4
21.0
103.0
10.2
111.6
67.4
15.3 1.6
(95.4)
(67.4)
(61.8)
(129.2)
(44.3)
(13.7)
(92.8)
Cash flows
Billions of yen
(Years ended March 31)
Total assets Equity Equity ratio Financial debt Net financial debt Cash flows from operating activities
Cash flows from investing activities
Free cash flow
Mazda Annual Report 201 1 47