Mazda 2009 Annual Report Download - page 70
Download and view the complete annual report
Please find page 70 of the 2009 Mazda annual report below. You can navigate through the pages in the report by either clicking on the pages listed below, or by using the keyword search tool below to find specific information within the annual report.-
 1
1 -
2
-
3
-
4
-
5
-
6
-
7
-
8
-
9
-
10
-
11
-
12
-
13
-
14
-
15
-
16
-
17
-
18
-
19
-
20
-
21
-
22
-
23
-
24
-
25
-
26
-
27
-
28
-
29
-
30
-
31
-
32
-
33
-
34
-
35
-
36
-
37
-
38
-
39
-
40
-
41
-
42
-
43
-
44
-
45
-
46
-
47
-
48
-
49
-
50
-
51
-
52
-
53
-
54
-
55
-
56
-
57
-
58
-
59
-
 60
60 -
 61
61 -
 62
62 -
 63
63 -
 64
64 -
 65
65 -
 66
66 -
 67
67 -
 68
68 -
 69
69 -
 70
70 -
 71
71 -
 72
72 -
 73
73 -
 74
74 -
 75
75 -
 76
76
 |
 |

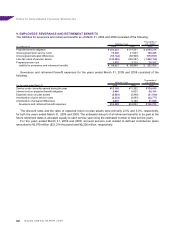
Thousands of U.S. dollars
For the year ended North Elimination
March 31, 2009 Japan America Europe Other areas Total or corporate Consolidated
Net sales:
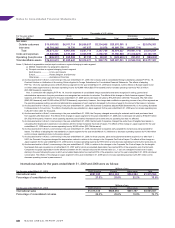
Outside customers $10,090,092 $6,911,714 $6,539,837 $2,334,908 $25,876,551 $ — $25,876,551
Inter-area 10,781,245 75,776 117,877 22,878 10,997,776 (10,997,776) —
Total 20,871,337 6,987,490 6,657,714 2,357,786 36,874,327 (10,997,776) 25,876,551
Costs and expenses 21,840,868 6,727,408 6,569,959 2,258,745 37,396,980 (11,230,827) 26,166,153
Operating (loss)/income $ (969,531) $ 260,082 $ 87,755 $ 99,041 $ (522,653) $ 233,051 $ (289,602)
Total identifiable assets $16,401,673 $1,900,643 $2,016,571 $ 588,174 $20,907,061 $ (2,529,704) $18,377,357
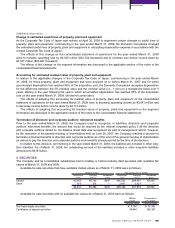
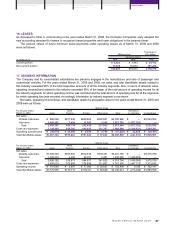
Notes: 1) Method of segmentation and principal countries or regions belonging to each segment
a) Method: Segmentation by geographic adjacency
b) Principal countries or regions belonging to each segment
North America ................U.S.A. and Canada
Europe ............................Russia, Belgium, and Germany
Other areas ....................Australia and Colombia
2) As discussed earlier in Note 3, commencing in the year ended March 31, 2009, the Company and its consolidated foreign subsidiaries adopted PITF No. 18,
Practical Solution on Unification of Accounting Policies Applied to Foreign Subsidiaries for Consolidated Financial Statements. The effects of adopting
PITF No. 18 on the operating income of North America segment for the year ended March 31, 2009 were immaterial, but the effects on Europe segment and
on Other areas segment were to decrease operating income by ¥2,898 million ($29,571 thousand) and to increase operating income by ¥3,125 million
($31,888 thousand), respectively.
Also, in connection with adopting PITF No. 18, incentive expenses of consolidated foreign subsidiaries that were recognized in selling, general and
administrative expenses in the prior periods are now recognized as a reduction to net sales. The effects of this change on North America segment, Europe
segment, and Other areas segment for the year ended March 31, 2009 were to decrease net sales by ¥73,289 million ($747,847 thousand), ¥62,725 million
($640,051 thousand), and ¥10,683 million ($109,010 thousand), respectively. However, this change had no effects on operating income of any of the segments as
the operating expense (selling, general and administrative expenses) of each segment decreased by the amount equal to the amount of decrease in net sales.
3) As discussed earlier in Note 3, commencing in the year ended March 31, 2009, the Domestic Companies adopted ASBJ Statement No. 9, Accounting Standards
for Measurement of Inventories. The effects of adopting the new standard on Japan segment for the year ended March 31, 2009 were to increase operating loss
by ¥2,461 million ($25,112 thousand).
4) As discussed earlier in Note 3, commencing in the year ended March 31, 2009, the Company changed accounting for materials sold to and purchased back
from suppliers after fabrication. The effects of this change on Japan segment for the year ended March 31, 2009 were to decrease net sales by ¥152,097 million
($1,552,010 thousand). However, since operating expense (cost of sales) decreased by the same amount, operating loss was not affected.
5) As discussed earlier in Note 3, commencing in the year ended March 31, 2009, the Domestic Companies changed the useful lives of tangible fixed assets in
calculating their depreciation expenses in accordance with the revised Corporate Tax Code of Japan. The effects of this change on Japan segment for the year
ended March 31, 2009 were to increase operating loss by ¥2,325 million ($23,724 thousand).
6) As discussed earlier in Note 3, commencing in the year ended March 31, 2008, the Domestic Companies early adopted the revised accounting standard for
leases. The effects of adopting the new standards on Japan segment for the year ended March 31, 2008 were to decrease operating expense by ¥1,199 million
and to increase operating income by the same amount.
7) As discussed earlier in Note 3, commencing in the year ended March 31, 2008, for those property, plant and equipment that were acquired on or after April 1,
2007, the Domestic Companies changed the depreciation method in relation to the change in the Corporate Tax Code of Japan. The effects of this change on
Japan segment for the year ended March 31, 2008 were to increase operating expense by ¥910 million and to decrease operating income by the same amount.
8) As discussed earlier in Note 3, commencing in the year ended March 31, 2008, in relation to the changes in the Corporate Tax Code of Japan, for the tangible
fixed assets that were acquired on or before March 31, 2007 and for which accumulated depreciation has reached 95% of the acquisition cost, the Domestic
Companies recognize depreciation for the difference between the 5% residual value and the nominal value (i.e., 1 yen) on a straight-line basis over 5 years,
starting in the year following the year in which accumulated depreciation has reached 95% of the acquisition cost (or the year ending March 31, 2008, whichever
comes later). The effects of this change on Japan segment for the year ended March 31, 2008 were to increase operating expense by ¥3,951 million and to
decrease operating income by same amount.
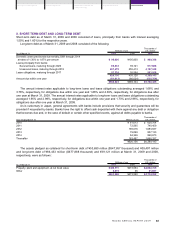
International sales for the years ended March 31, 2009 and 2008 were as follows:
Millions of yen
For the year ended March 31, 2009 North America Europe Other areas Total
International sales ¥697,600 ¥653,382 ¥564,584 ¥1,915,566
Percentage of consolidated net sales 27.5% 25.8% 22.2% 75.5%
Millions of yen
For the year ended March 31, 2008 North America Europe Other areas Total
International sales ¥1,015,315 ¥888,555 ¥691,787 ¥2,595,657
Percentage of consolidated net sales 29.2% 25.6% 19.9% 74.7%
Notes to Consolidated Financial Statements
68