Mazda 2009 Annual Report Download - page 54
Download and view the complete annual report
Please find page 54 of the 2009 Mazda annual report below. You can navigate through the pages in the report by either clicking on the pages listed below, or by using the keyword search tool below to find specific information within the annual report.-
 1
1 -
2
-
3
-
4
-
5
-
6
-
7
-
8
-
9
-
10
-
11
-
12
-
13
-
14
-
15
-
16
-
17
-
18
-
19
-
20
-
21
-
22
-
23
-
24
-
25
-
26
-
27
-
28
-
29
-
30
-
31
-
32
-
33
-
34
-
35
-
36
-
37
-
38
-
39
-
40
-
41
-
42
-
43
-
 44
44 -
 45
45 -
 46
46 -
 47
47 -
 48
48 -
 49
49 -
 50
50 -
 51
51 -
 52
52 -
 53
53 -
 54
54 -
 55
55 -
 56
56 -
 57
57 -
 58
58 -
 59
59 -
 60
60 -
 61
61 -
 62
62 -
 63
63 -
 64
64 -
65
-
66
-
67
-
68
-
69
-
70
-
71
-
72
-
73
-
74
-
75
-
76
 |
 |

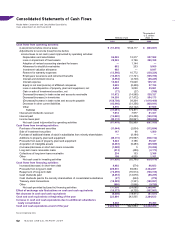
Consolidated Statements of Cash Flows
Thousands of
U.S. dollars
Millions of yen (Note 1)
2009 2008 2009
Cash flows from operating activities:
(Loss)/income before income taxes ¥ (51,339) ¥143,117 $ (523,867)
Adjustments to reconcile (loss)/income before
income taxes to net cash (used in)/provided by operating activities:
Depreciation and amortization 84,043 74,217 857,582
Loss on impairment of fixed assets 28,262 2,196 288,388
Adoption of revised accounting standard for leases — 1,144 —
Allowance for doubtful receivables 882 253 9,000
Investment valuation allowance 965 — 9,847
Reserve for warranty expenses (13,546) 10,772 (138,224)
Employees’ severance and retirement benefits (10,367) (11,721) (105,786)
Interest and dividend income (3,552) (4,740) (36,245)
Interest expense 14,224 19,020 145,143
Equity in net loss/(income) of affiliated companies 2,665 (8,409) 27,194
Loss on sale/disposition of property, plant and equipment, net 2,456 3,030 25,061
Gain on sale of investment securities, net (77) (27) (786)
Decrease/(increase) in trade notes and accounts receivable 51,972 (14,595) 530,327
Decrease/(increase) in inventories 54,309 (17,472) 554,173
(Decrease)/increase in trade notes and accounts payable (158,708) 39,204 (1,619,469)
Decrease in other current liabilities (42,046) (31,356) (429,041)
Other 8,576 (32,122) 87,509
Subtotal (31,281) 172,511 (319,194)
Interest and dividends received 7,974 7,977 81,367
Interest paid (13,800) (19,458) (140,816)
Income taxes paid (30,311) (58,061) (309,296)
Net cash (used in)/provided by operating activities (67,418) 102,969 (687,939)
Cash flows from investing activities:
Purchase of investment securities (11,044) (2,004) (112,694)
Sale of investment securities 147 98 1,500
Purchase of additional shares of stock in subsidiaries from minority shareholders — (9,194) —
Additions to property, plant and equipment (49,011) (79,597) (500,112)
Proceeds from sale of property, plant and equipment 5,424 3,186 55,347
Acquisition of intangible assets (6,463) (9,483) (65,949)
(Increase)/decrease in short-term loans receivable (1,008) 5 (10,286)
Long-term loans receivable made (213) (459) (2,173)
Collections of long-term loans receivable 234 153 2,388
Other 108 4,535 1,101
Net cash used in investing activities (61,826) (92,760) (630,878)
Cash flows from financing activities:
Increase/(decrease) in short-term debt 8,492 (574) 86,653
Proceeds from long-term debt 228,816 69,094 2,334,857
Repayment of long-term debt (72,355) (76,914) (738,316)
Cash dividends paid (8,453) (12,670) (86,255)
Cash dividends paid to the minority shareholders of consolidated subsidiaries (27) (644) (276)
Treasury stock transactions (18,505) (1,321) (188,827)
Other (960) (1,066) (9,795)
Net cash provided by/(used in) financing activities 137,008 (24,095) 1,398,041
Effect of exchange rate fluctuations on cash and cash equivalents (16,372) (4,725) (167,061)
Net decrease in cash and cash equivalents (8,608) (18,611) (87,837)
Cash and cash equivalents at beginning of the year 223,894 242,505 2,284,633
Increase in cash and cash equivalents due to additional subsidiaries
newly consolidated 5,438 — 55,490
Cash and cash equivalents at end of the year ¥ 220,724 ¥223,894 $ 2,252,286
See accompanying notes.
52