Mazda 2009 Annual Report Download - page 69
Download and view the complete annual report
Please find page 69 of the 2009 Mazda annual report below. You can navigate through the pages in the report by either clicking on the pages listed below, or by using the keyword search tool below to find specific information within the annual report.-
 1
1 -
2
-
3
-
4
-
5
-
6
-
7
-
8
-
9
-
10
-
11
-
12
-
13
-
14
-
15
-
16
-
17
-
18
-
19
-
20
-
21
-
22
-
23
-
24
-
25
-
26
-
27
-
28
-
29
-
30
-
31
-
32
-
33
-
34
-
35
-
36
-
37
-
38
-
39
-
40
-
41
-
42
-
43
-
44
-
45
-
46
-
47
-
48
-
49
-
50
-
51
-
52
-
53
-
54
-
55
-
56
-
57
-
58
-
 59
59 -
 60
60 -
 61
61 -
 62
62 -
 63
63 -
 64
64 -
 65
65 -
 66
66 -
 67
67 -
 68
68 -
 69
69 -
 70
70 -
 71
71 -
 72
72 -
 73
73 -
 74
74 -
 75
75 -
 76
76
 |
 |

Review of OperationsMessages from Management Mazda’s Environmental and
Safety Technology
Corporate Information Financial Section
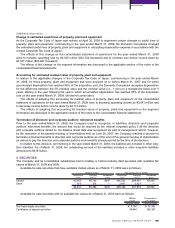
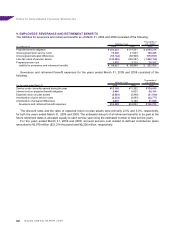
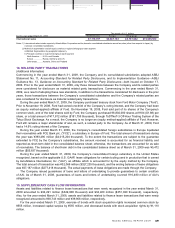
16. LEASES
As discussed in Note 3, commencing in the year ended March 31, 2008, the Domestic Companies early adopted the
new accounting standard for leases to recognize leased properties and lease obligations in the balance sheet.
The present values of future minimum lease payments under operating leases as of March 31, 2009 and 2008
were as follows:
Thousands of
Millions of yen U.S. dollars
Operating leases
As of March 31 2009 2008 2009
Current portion ¥ 2,852 ¥ 3,443 $ 29,102
Non-current portion 13,845 16,072 141,276
¥16,697 ¥19,515 $170,378
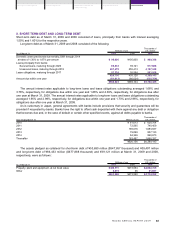
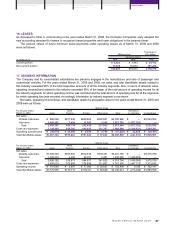
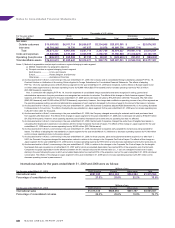
17. SEGMENT INFORMATION
The Company and its consolidated subsidiaries are primarily engaged in the manufacture and sale of passenger and
commercial vehicles. For the years ended March 31, 2009 and 2008, net sales and total identifiable assets related to
this industry exceeded 90% of the total respective amounts of all the industry segments. Also, in terms of absolute value,
operating income/(loss) related to this industry exceeded 90% of the larger of the total amount of operating income for all
the industry segments for which operating income was recorded and the total amount of operating loss for all the segments
for which operating loss was recorded. Accordingly, information by industry segment is not shown.
Net sales, operating income/(loss), and identifiable assets by geographic area for the years ended March 31, 2009 and
2008 were as follows:
Millions of yen
For the year ended North Elimination
March 31, 2009 Japan America Europe Other areas Total or corporate Consolidated
Net sales:
Outside customers ¥ 988,829 ¥677,348 ¥640,904 ¥228,821 ¥2,535,902 ¥ — ¥2,535,902
Inter-area 1,056,562 7,426 11,552 2,242 1,077,782 (1,077,782) —
Total 2,045,391 684,774 652,456 231,063 3,613,684 (1,077,782) 2,535,902
Costs and expenses 2,140,405 659,286 643,856 221,357 3,664,904 (1,100,621) 2,564,283
Operating (loss)/income ¥ (95,014) ¥ 25,488 ¥ 8,600 ¥ 9,706 ¥ (51,220) ¥ 22,839 ¥ (28,381)
Total identifiable assets ¥1,607,364 ¥186,263 ¥197,624 ¥ 57,641 ¥2,048,892 ¥ (247,911) ¥1,800,981
Millions of yen
For the year ended North Elimination
March 31, 2008 Japan America Europe Other areas Total or corporate Consolidated
Net sales:
Outside customers ¥1,289,248 ¥974,504 ¥872,616 ¥339,421 ¥3,475,789 ¥ — ¥3,475,789
Inter-area 1,408,934 4,469 22,201 2,401 1,438,005 (1,438,005) —
Total 2,698,182 978,973 894,817 341,822 4,913,794 (1,438,005) 3,475,789
Costs and expenses 2,590,533 972,986 876,835 321,001 4,761,355 (1,447,713) 3,313,642
Operating income ¥ 107,649 ¥ 5,987 ¥ 17,982 ¥ 20,821 ¥ 152,439 ¥ 9,708 ¥ 162,147
Total identifiable assets ¥1,775,855 ¥174,719 ¥179,411 ¥ 68,629 ¥2,198,614 ¥ (213,048) ¥1,985,566
67