Mazda 2009 Annual Report Download - page 46
Download and view the complete annual report
Please find page 46 of the 2009 Mazda annual report below. You can navigate through the pages in the report by either clicking on the pages listed below, or by using the keyword search tool below to find specific information within the annual report.-
 1
1 -
2
-
3
-
4
-
5
-
6
-
7
-
8
-
9
-
10
-
11
-
12
-
13
-
14
-
15
-
16
-
17
-
18
-
19
-
20
-
21
-
22
-
23
-
24
-
25
-
26
-
27
-
28
-
29
-
30
-
31
-
32
-
33
-
34
-
35
-
 36
36 -
 37
37 -
 38
38 -
 39
39 -
 40
40 -
 41
41 -
 42
42 -
 43
43 -
 44
44 -
 45
45 -
 46
46 -
 47
47 -
 48
48 -
 49
49 -
 50
50 -
 51
51 -
 52
52 -
 53
53 -
 54
54 -
 55
55 -
 56
56 -
57
-
58
-
59
-
60
-
61
-
62
-
63
-
64
-
65
-
66
-
67
-
68
-
69
-
70
-
71
-
72
-
73
-
74
-
75
-
76
 |
 |
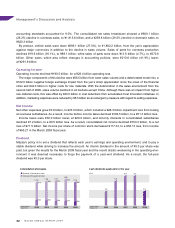
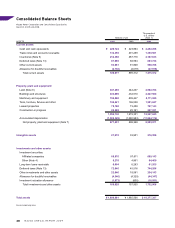
Financial Position
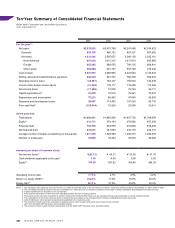
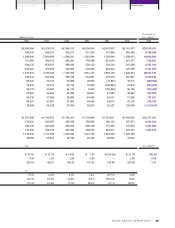
Total assets as of March 31, 2009, stood at ¥1,801.0 billion, which was ¥184.6 billion lower than at the previous
year-end as a result of reductions in inventories and trade receivables. Cash and cash equivalents (“cash”)
decreased ¥3.2 billion, to ¥220.7 billion. Inventories were reduced by ¥73.3 billion, to ¥214.4 billion. Net
property, plant and equipment decreased ¥21.0 billion, to ¥877.4 billion.
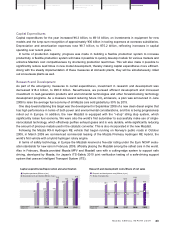
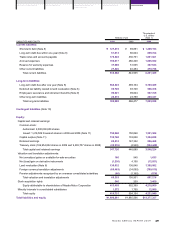
The total short- and long-term interest-bearing debt grew ¥248.4 billion, to ¥753.4 billion. Net interest-bearing
debt, which deducts the ¥220.7 billion in cash as of the fiscal year-end, increased ¥251.5 billion, to ¥532.6
billion, thereby resulting in a 78 percentage point rise in the net debt-to-equity ratio, to 129%.
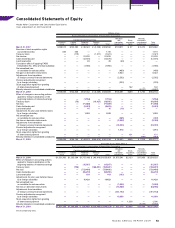
Equity as of the fiscal year-end decreased ¥139.4 billion from the previous year-end, to ¥414.7 billion. Equity
per share decreased ¥76.84 (19.6%), to ¥314.98, from ¥391.82 at the end of the previous year. Equity—calcu-
lated as net assets less minority interests and stock acquisition rights—stood at ¥413.1 billion, for a 4.9
percentage point decline in the equity ratio, to 22.9%.
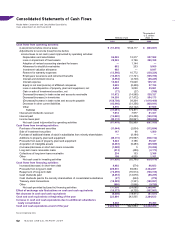
Cash Flows
Cash and cash equivalents (“cash”) as of March 31, 2009, totaled ¥220.7 billion, which was ¥3.2 billion less than
at the previous fiscal year-end. Although financing activities generated ¥137.0 billion in net cash, operating
activities and investing activities used cash in the amount of ¥67.4 billion and ¥61.8 billion, respectively.
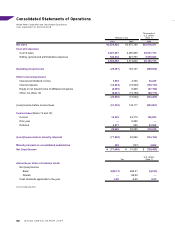
(Cash Flow from Operating Activities)
Operating activities during the year used net cash in the amount of ¥67.4 billion. Loss before income taxes was
¥51.3 billion, while depreciation and amortization was ¥75.2 billion. However, accompanying reduced production
and other factors, decrease in trade notes and accounts payable was ¥158.7 billion, and income taxes paid was
¥30.3 billion.
(Cash Flow from Investing Activities)
Investing activities used net cash in the amount of ¥61.8 billion, the main component of which was ¥49.0 billion
of capital expenditures for the acquisition of plant and equipment.
(Cash Flow from Financing Activities)
Financing activities generated net cash of ¥137.0 billion. The Company procured funds through long-term
borrowing while repaying interest-bearing debt and acquiring treasury stock.
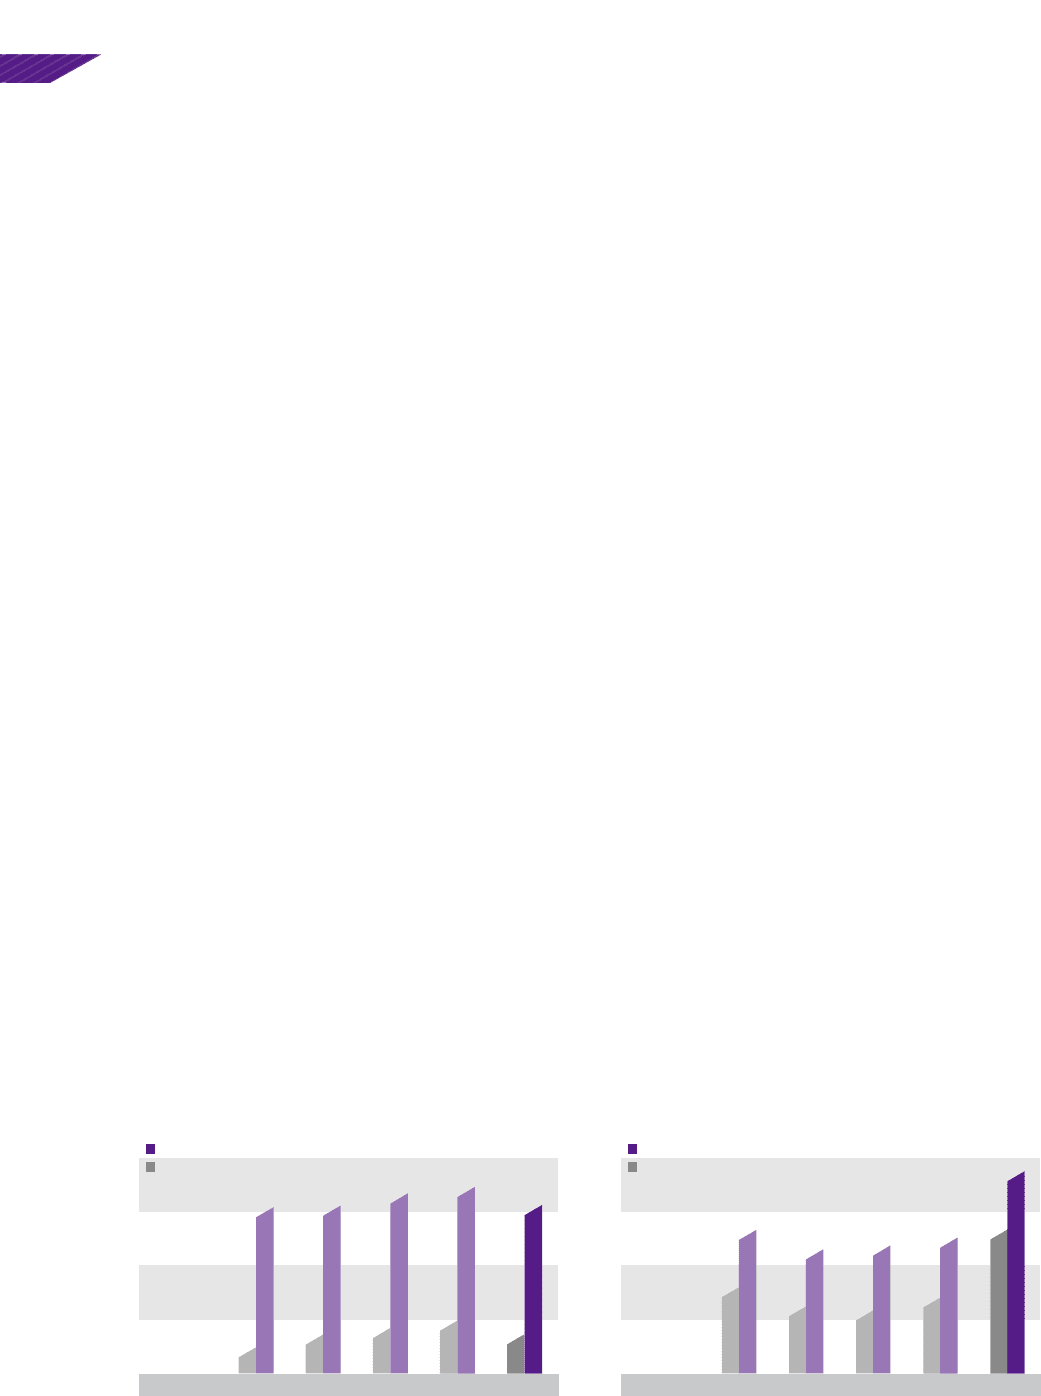
1,767.8 1,788.7
1,907.8 1,985.6
275.8
407.2 479.9 554.2
1,801.0
414.7
Total assets (Billions of yen)
Equity (Billions of yen)
)'', )''- )''. )''/ )''0
(As of March 31)
KfkXcXjj\kj&<hl`kp
528.1
455.4 474.7 505.0
313.5
246.8 232.2
281.1
753.4
532.6
Financial debt (Billions of yen)
Net financial debt (Billions of yen)
)'', )''- )''. )''/ )''0
(As of March 31)
=`eXeZ`Xc[\Yk&E\k]`eXeZ`Xc[\Yk
Management’s Discussion and Analysis
44