Mazda 2009 Annual Report Download - page 4
Download and view the complete annual report
Please find page 4 of the 2009 Mazda annual report below. You can navigate through the pages in the report by either clicking on the pages listed below, or by using the keyword search tool below to find specific information within the annual report.-
 1
1 -
 2
2 -
 3
3 -
 4
4 -
 5
5 -
 6
6 -
 7
7 -
 8
8 -
 9
9 -
 10
10 -
 11
11 -
 12
12 -
 13
13 -
 14
14 -
 15
15 -
16
-
17
-
18
-
19
-
20
-
21
-
22
-
23
-
24
-
25
-
26
-
27
-
28
-
29
-
30
-
31
-
32
-
33
-
34
-
35
-
36
-
37
-
38
-
39
-
40
-
41
-
42
-
43
-
44
-
45
-
46
-
47
-
48
-
49
-
50
-
51
-
52
-
53
-
54
-
55
-
56
-
57
-
58
-
59
-
60
-
61
-
62
-
63
-
64
-
65
-
66
-
67
-
68
-
69
-
70
-
71
-
72
-
73
-
74
-
75
-
76
 |
 |

2
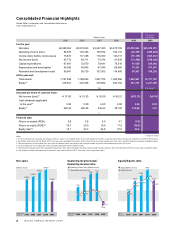
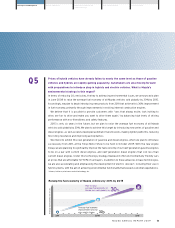
Consolidated Financial Highlights
¥$
Net sales
)'', )''- )''. )''/ )''0
(Years ended
March 31)
2,695.6
2,919.8
3,247.5
3,475.8
2,535.9
(Billions of yen)
Operating income (loss)/
Operating income ratio
)'', )''- )''. )''/ )''0
(Years ended
March 31)
82.9
123.4
158.5 162.1
(28.4)
(1.1)
4.7
4.9
4.2
3.1
Operating income (loss) (Billions of yen)
Operating income ratio (%)
Equity/Equity ratio
)'', )''- )''. )''/ )''0
(As of
March 31)
275.8
407.2
479.9
554.2
414.7
22.9
27.8
24.8
22.3
15.1
Equity (Billions of yen)
Equity ratio (%)
Thousands of
Millions of yen U.S. dollars*1
2005 2006 2007 2008 2009 2009
For the year:
Net sales ¥2,695,564 ¥2,919,823 ¥3,247,485 ¥3,475,789 ¥2,535,902 $25,876,551
Operating income (loss) 82,947 123,435 158,532 162,147 (28,381) (289,602)
Income (loss) before income taxes 73,847 117,468 118,450 143,117 (51,339) (523,867)
Net income (loss) 45,772 66,711 73,744 91,835 (71,489) (729,480)
Capital expenditures 67,881 72,070 79,641 75,518 81,838 835,082
Depreciation and amortization 40,036 45,805 47,045 66,460 75,221 767,561
Research and development costs 90,841 95,730 107,553 114,400 95,967 979,255
At the year-end:
Total assets 1,767,846 1,788,659 1,907,752 1,985,566 1,800,981 18,377,357
Equity*2 275,841 407,208 479,882 554,154 414,731 4,231,949
Yen U.S. dollars*1
Amounts per share of common stock:
Net income (loss)*3 ¥ 37.63 ¥ 51.53 ¥ 52.59 ¥ 65.21 ¥(52.13) $(0.53)
Cash dividends applicable
to the year*4 3.00 5.00 6.00 6.00 3.00 0.03
Equity*5 220.22 284.28 336.45 391.82 314.98 3.21
%
Financial data:
Return on assets (ROA) 2.6 3.8 4.0 4.7 (3.8)
Return on equity (ROE)*6 18.7 20.0 16.9 17.9 (14.8)
Equity ratio*6 15.1 22.3 24.8 27.8 22.9