Mazda 2009 Annual Report Download - page 5
Download and view the complete annual report
Please find page 5 of the 2009 Mazda annual report below. You can navigate through the pages in the report by either clicking on the pages listed below, or by using the keyword search tool below to find specific information within the annual report.-
 1
1 -
 2
2 -
 3
3 -
 4
4 -
 5
5 -
 6
6 -
 7
7 -
 8
8 -
 9
9 -
 10
10 -
 11
11 -
 12
12 -
 13
13 -
 14
14 -
 15
15 -
 16
16 -
17
-
18
-
19
-
20
-
21
-
22
-
23
-
24
-
25
-
26
-
27
-
28
-
29
-
30
-
31
-
32
-
33
-
34
-
35
-
36
-
37
-
38
-
39
-
40
-
41
-
42
-
43
-
44
-
45
-
46
-
47
-
48
-
49
-
50
-
51
-
52
-
53
-
54
-
55
-
56
-
57
-
58
-
59
-
60
-
61
-
62
-
63
-
64
-
65
-
66
-
67
-
68
-
69
-
70
-
71
-
72
-
73
-
74
-
75
-
76
 |
 |

3
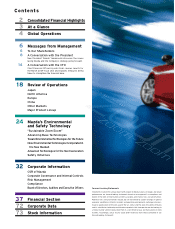
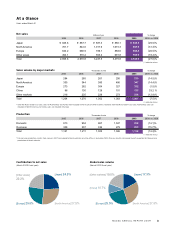
At a Glance
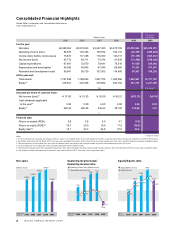
Billions of yen % change
2005 2006 2007 2008 2009 2009 vs 2008
Japan ¥ 845.6 ¥ 887.7 ¥ 887.3 ¥ 880.1 ¥ 620.3 (29.5)%
North America 761.7 844.0 1,017.9 1,015.3 697.6 (31.3)%
Europe 634.2 668.9 789.1 888.6 653.4 (26.5)%
Other areas 454.1 519.2 553.2 691.8 564.6 (18.4)%
Total 2,695.6 2,919.8 3,247.5 3,475.8 2,535.9 (27.0)%
Net sales
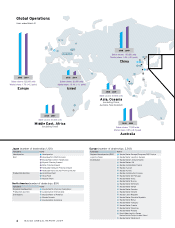
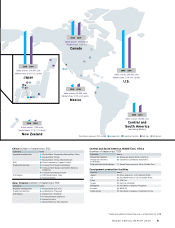
Thousands of units % change
2005 2006 2007 2008 2009 2009 vs 2008
Japan 284 285 261 256 219 (14.5)%
North America 335 344 380 406 347 (14.4)%
Europe 273 282 304 327 322 (1.5)%
China 96 130 129 101 135 33.2 %
Other markets 216 235 228 273 238 (12.8)%
Total 1,204 1,276 1,302 1,363 1,261 (7.5)%
Sales volume by major markets
Thousands of units % change
2005 2006 2007 2008 2009 2009 vs 2008
Domestic 813 904 967 1,047 899 (14.1)%
Overseas 308 307 336 279 235 (15.7)%
Total 1,121 1,211 1,1,303 1,326 1,134 (14.4)%
Production
Global sales volume
[Japan] 17.3%
[Other markets] 19.0%
[North America] 27.5%
[China] 10.7%
[Europe] 25.5%
Contribution to net sales
[Japan] 24.5%
[Other areas]
22.2%
[North America] 27.5%[Europe] 25.8%