Mazda 2009 Annual Report Download - page 47
Download and view the complete annual report
Please find page 47 of the 2009 Mazda annual report below. You can navigate through the pages in the report by either clicking on the pages listed below, or by using the keyword search tool below to find specific information within the annual report.-
 1
1 -
2
-
3
-
4
-
5
-
6
-
7
-
8
-
9
-
10
-
11
-
12
-
13
-
14
-
15
-
16
-
17
-
18
-
19
-
20
-
21
-
22
-
23
-
24
-
25
-
26
-
27
-
28
-
29
-
30
-
31
-
32
-
33
-
34
-
35
-
36
-
 37
37 -
 38
38 -
 39
39 -
 40
40 -
 41
41 -
 42
42 -
 43
43 -
 44
44 -
 45
45 -
 46
46 -
 47
47 -
 48
48 -
 49
49 -
 50
50 -
 51
51 -
 52
52 -
 53
53 -
 54
54 -
 55
55 -
 56
56 -
 57
57 -
58
-
59
-
60
-
61
-
62
-
63
-
64
-
65
-
66
-
67
-
68
-
69
-
70
-
71
-
72
-
73
-
74
-
75
-
76
 |
 |

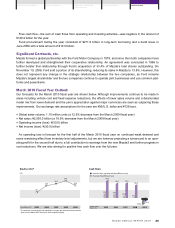
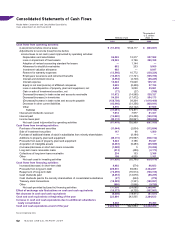
Free cash flow—the sum of cash flows from operating and investing activities—was negative in the amount of
¥129.2 billion for the year.
Fund procurement during the year consisted of ¥211.9 billion in long-term borrowing and a bond issue in
June 2008 with a total amount of ¥10.0 billion.
Significant Contracts, etc.
Mazda formed a global partnership with the Ford Motor Company in 1979, and since then both companies have
further developed and strengthened their cooperative relationship. An agreement was concluded in 1996 to
further bolster that relationship through Ford’s acquisition of 33.4% of Mazda’s total shares outstanding. On
November 19, 2008, Ford sold a portion of its shareholding, reducing its stake in Mazda to 13.8%. However, this
does not represent any change in the strategic relationship between the two companies, as Ford remains
Mazda’s largest shareholder and the two companies continue to operate joint businesses and use common plat-
forms and powertrains.
March 2010 Fiscal Year Outlook
Our forecasts for the March 2010 fiscal year are shown below. Although improvements continue to be made in
areas including vehicle cost and fixed expense reductions, the effects of lower sales volume and a deteriorated
model mix from lower demand and the yen’s appreciation against major currencies are seen as outpacing these
improvements. Our exchange rate assumptions for the year are ¥95/U.S. dollar and ¥125/euro.
● Global sales volume: 1.10 million units (a 12.8% decrease from the March 2009 fiscal year)
● Net sales: ¥2,030.0 billion (a 19.9% decrease from the March 2009 fiscal year)
● Operating income (loss): ¥(50.0) billion
● Net income (loss): ¥(50.0) billion
An operating loss is forecast for the first half of the March 2010 fiscal year on continued weak demand and
some remaining effect from inventory level adjustments, but we are however projecting a turnaround to an oper-
ating profit for the second half due to a full contribution to earnings from the new Mazda3 and further progress in
cost reductions. We are also aiming for positive free cash flow over the full year.
15.1
24.8
27.8
22.9
22.3
)'', )''- )''. )''/ )''0
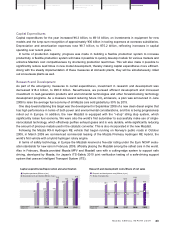
* The amounts of equity used in the calculation of equity ratio exclude minority interests
(and, from the March 2007 fiscal year, stock acquisition rights).
(%)
(As of March 31)
<hl`kpiXk`f!
35.9 33.6 21.0 10.2
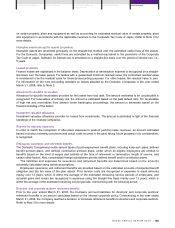
133.7
114.6 116.4
103.0
67.4
129.2
)'', )''- )''. )''/ )''0
(Years ended
March 31)
Free cash flow (Billions of yen)
Cash flow from operating activities (Billions of yen)
:Xj_]cfnj
45
Review of OperationsMessages from Management Mazda’s Environmental and
Safety Technology
Corporate Information Financial Section