Mazda 2008 Annual Report Download - page 84
Download and view the complete annual report
Please find page 84 of the 2008 Mazda annual report below. You can navigate through the pages in the report by either clicking on the pages listed below, or by using the keyword search tool below to find specific information within the annual report.-
 1
1 -
2
-
3
-
4
-
5
-
6
-
7
-
8
-
9
-
10
-
11
-
12
-
13
-
14
-
15
-
16
-
17
-
18
-
19
-
20
-
21
-
22
-
23
-
24
-
25
-
26
-
27
-
28
-
29
-
30
-
31
-
32
-
33
-
34
-
35
-
36
-
37
-
38
-
39
-
40
-
41
-
42
-
43
-
44
-
45
-
46
-
47
-
48
-
49
-
50
-
51
-
52
-
53
-
54
-
55
-
56
-
57
-
58
-
59
-
60
-
61
-
62
-
63
-
64
-
65
-
66
-
67
-
68
-
69
-
70
-
71
-
72
-
73
-
 74
74 -
 75
75 -
 76
76 -
 77
77 -
 78
78 -
 79
79 -
 80
80 -
 81
81 -
 82
82 -
 83
83 -
 84
84 -
 85
85 -
 86
86 -
 87
87 -
 88
88 -
 89
89 -
 90
90
 |
 |

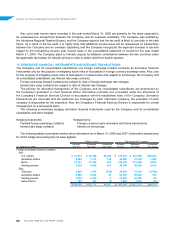
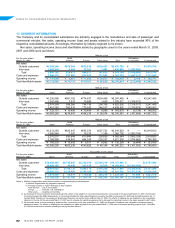
17. SEGMENT INFORMATION
The Company and its consolidated subsidiaries are primarily engaged in the manufacture and sale of passenger and
commercial vehicles. Net sales, operating income (loss) and assets related to this industry have exceeded 90% of the
respective consolidated amounts. Accordingly, information by industry segment is not shown.
Net sales, operating income (loss) and identifiable assets by geographic area for the years ended March 31, 2008,
2007 and 2006 were as follows:
Millions of yen
For the year ended North Elimination
March 31, 2008 Japan America Europe Other areas Total or corporate Consolidated
Net sales:
Outside customers ¥1,289,248 ¥974,504 ¥872,616 ¥339,421 ¥3,475,789 ¥ — ¥3,475,789
Inter-area 1,408,934 4,469 22,201 2,401 1,438,005 (1,438,005) —
Total 2,698,182 978,973 894,817 341,822 4,913,794 (1,438,005) 3,475,789
Costs and expenses 2,590,533 972,986 876,835 321,001 4,761,355 (1,447,713) 3,313,642
Operating income ¥ 107,649 ¥ 5,987 ¥ 17,982 ¥ 20,821 ¥ 152,439 ¥ 9,708 ¥ 162,147
Total identifiable assets ¥1,775,855 ¥174,719 ¥179,411 ¥ 68,629 ¥2,198,614 ¥ (213,048) ¥1,985,566
Millions of yen
For the year ended North Elimination
March 31, 2007 Japan America Europe Other areas Total or corporate Consolidated
Net sales:
Outside customers ¥1,226,988 ¥991,192 ¥774,837 ¥254,468 ¥3,247,485 ¥ — ¥3,247,485
Inter-area 1,347,406 7,074 19,899 1,638 1,376,017 (1,376,017) —
Total 2,574,394 998,266 794,736 256,106 4,623,502 (1,376,017) 3,247,485
Costs and expenses 2,451,263 982,810 779,242 246,517 4,459,832 (1,370,879) 3,088,953
Operating income ¥ 123,131 ¥ 15,456 ¥ 15,494 ¥ 9,589 ¥ 163,670 ¥ (5,138) ¥ 158,532
Total identifiable assets ¥1,663,264 ¥219,947 ¥166,276 ¥ 56,074 ¥2,105,561 ¥ (197,809) ¥1,907,752
Millions of yen
For the year ended North Elimination
March 31, 2006 Japan America Europe Other areas Total or corporate Consolidated
Net sales:
Outside customers ¥1,213,283 ¥823,447 ¥655,370 ¥227,723 ¥2,919,823 ¥ — ¥2,919,823
Inter-area 1,056,948 7,397 18,275 1,106 1,083,726 (1,083,726) —
Total 2,270,231 830,844 673,645 228,829 4,003,549 (1,083,726) 2,919,823
Costs and expenses 2,169,998 816,941 664,074 220,237 3,871,250 (1,074,862) 2,796,388
Operating income ¥ 100,233 ¥ 13,903 ¥ 9,571 ¥ 8,592 ¥ 132,299 ¥ (8,864) ¥ 123,435
Total identifiable assets ¥1,556,200 ¥202,238 ¥143,626 ¥ 48,148 ¥1,950,212 ¥ (161,553) ¥1,788,659
Thousands of U.S. dollars
For the year ended North Elimination
March 31, 2008 Japan America Europe Other areas Total or corporate Consolidated
Net sales:
Outside customers $12,892,480 $9,745,040 $8,726,160 $3,394,210 $34,757,890 $ — $34,757,890
Inter-area 14,089,340 44,690 222,010 24,010 14,380,050 (14,380,050) —
Total 26,981,820 9,789,730 8,948,170 3,418,220 49,137,940 (14,380,050) 34,757,890
Costs and expenses 25,905,330 9,729,860 8,768,350 3,210,010 47,613,550 (14,477,130) 33,136,420
Operating income $ 1,076,490 $ 59,870 $ 179,820 $ 208,210 $ 1,524,390 $ 97,080 $ 1,621,470
Total identifiable assets $17,758,550 $1,747,190 $1,794,110 $ 686,290 $21,986,140 $ (2,130,480) $19,855,660
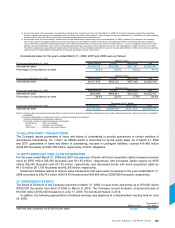
Notes: 1) Method of segmentation and principal counties or regions belonging to each segment
a) Method: Segmentation by geographic adjacency
b) Principal countries or regions belonging to each segment
North America .....U.S.A. and Canada
Europe .................Germany, U.K. and Belgium
Other areas .........Australia and Colombia
2) As discussed in the accounting for share-based payment section of the adoption of new accounting standards, commencing in the year ended March 31, 2007, the Domestic
Companies adopted the ASBJ Statement No. 8, Accounting Standard for Share-based Payment, issued by the ASBJ on December 27, 2005 and the ASBJ Guidance No. 11
(revised 2006), Guidance on Accounting for Share-based Payment, last revised by the ASBJ on May 31, 2006. The effects of adopting the new standard on the consolidated
statement of income for the year ended March 31, 2007 were to increase the operating expenses and to decrease the operating income in the Japan segment by ¥67 million.
3) As discussed earlier in the accounting for leases section, commencing in the year ended March 31, 2008, the Domestic Companies early adopted the revised accounting
standard for leases. The effects of adopting the new standards on Japan segment for the year ended March 31, 2008 were to decrease operating expense by ¥1,199 million
($11,990 thousand) and to increase operating income by the same amount.