Mazda 2008 Annual Report Download - page 68
Download and view the complete annual report
Please find page 68 of the 2008 Mazda annual report below. You can navigate through the pages in the report by either clicking on the pages listed below, or by using the keyword search tool below to find specific information within the annual report.-
 1
1 -
2
-
3
-
4
-
5
-
6
-
7
-
8
-
9
-
10
-
11
-
12
-
13
-
14
-
15
-
16
-
17
-
18
-
19
-
20
-
21
-
22
-
23
-
24
-
25
-
26
-
27
-
28
-
29
-
30
-
31
-
32
-
33
-
34
-
35
-
36
-
37
-
38
-
39
-
40
-
41
-
42
-
43
-
44
-
45
-
46
-
47
-
48
-
49
-
50
-
51
-
52
-
53
-
54
-
55
-
56
-
57
-
 58
58 -
 59
59 -
 60
60 -
 61
61 -
 62
62 -
 63
63 -
 64
64 -
 65
65 -
 66
66 -
 67
67 -
 68
68 -
 69
69 -
 70
70 -
 71
71 -
 72
72 -
 73
73 -
 74
74 -
 75
75 -
 76
76 -
 77
77 -
 78
78 -
79
-
80
-
81
-
82
-
83
-
84
-
85
-
86
-
87
-
88
-
89
-
90
 |
 |

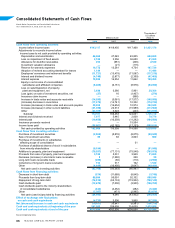
Thousands of
U.S dollars
Millions of yen (Note 1)
2008 2007 2006 2008
Cash flows from operating activities:
Income before income taxes ¥143,117 ¥118,450 ¥117,468 $1,431,170
Adjustments to reconcile income before
income taxes to net cash provided by operating activities:
Depreciation and amortization 66,460 47,045 45,805 664,600
Loss on impairment of fixed assets 2,196 3,356 36,650 21,960
Allowance for doubtful receivables 253 (981) (206) 2,530
Investment valuation allowance — (21) (115) —
Reserve for warranty expenses 10,772 13,281 4,734 107,720
Adoption of revised accounting standard for leases 1,144 — — 11,440
Employees’ severance and retirement benefits (11,721) (13,479) (71,087) (117,210)
Interest and dividend income (4,740) (2,877) (2,359) (47,400)
Interest expense 19,020 16,254 11,662 190,200
Equity in net income of unconsolidated
subsidiaries and affiliated companies (8,409) (6,151) (8,976) (84,090)
Loss on sale/disposition of property,
plant and equipment, net 3,030 3,380 5,961 30,300
Loss (gain) on sale of investment securities, net (27) 16 (1,407) (270)
Insurance claim income — — (996) —
Increase in trade notes and accounts receivable (14,595) (3,061) (17,577) (145,950)
(Increase) decrease in inventories (17,472) (14,741) 10,332 (174,720)
Increase (decrease) in trade notes and accounts payable 39,204 (16,654) 10,974 392,040
Increase (decrease) in other current liabilities (31,356) 22,313 (15,989) (313,560)
Other (24,365) 3,323 (243) (243,650)
Subtotal 172,511 169,453 124,631 1,725,110
Interest and dividends received 7,977 5,445 2,838 79,770
Interest paid (19,458) (16,358) (11,292) (194,580)
Insurance proceeds received — — 15,554 —
Income taxes paid (58,061) (42,182) (17,133) (580,610)
Net cash provided by operating activities 102,969 116,358 114,598 1,029,690
Cash flows from investing activities:
Purchase of investment securities (2,004) (5,876) (8,875) (20,040)
Sale of investment securities 98 92 2,823 980
Purchase of investments in subsidiaries
affecting scope of consolidation — — 31 —
Purchase of additional shares of stock in subsidiaries
from minority shareholders (9,194) — — (91,940)
Additions to property, plant and equipment (79,597) (77,131) (75,548) (795,970)
Proceeds from sale of property, plant and equipment 3,186 5,031 3,949 31,860
Decrease (increase) in short-term loans receivable 5 (1,280) 228 50
Long-term loans receivable made (459) (60) (110) (4,590)
Collections of long-term loans receivable 153 317 162 1,530
Other (4,948) (16,456) (3,647) (49,480)
Net cash used in investing activities (92,760) (95,363) (80,987) (927,600)
Cash flows from financing activities:
Decrease in short-term debt (574) (11,689) (8,845) (5,740)
Proceeds from long-term debt 69,094 95,091 92,102 690,940
Repayment of long-term debt (76,914) (62,133) (119,502) (769,140)
Cash dividends paid (12,670) (7,000) (3,930) (126,700)
Cash dividends paid to the minority shareholders
of consolidated subsidiaries (644) (4,452) (282) (6,440)
Other (2,387) (471) (2,995) (23,870)
Net cash (used in)/provided by financing activities (24,095) 9,346 (43,452) (240,950)
Effect of exchange rate fluctuations
on cash and cash equivalents (4,725) 3,506 3,860 (47,250)
Net (decrease)/increase in cash and cash equivalents (18,611) 33,847 (5,981) (186,110)
Cash and cash equivalents at beginning of the year 242,505 208,658 214,639 2,425,050
Cash and cash equivalents at end of the year ¥223,894 ¥242,505 ¥208,658 $2,238,940
See accompanying notes.