Mazda 2008 Annual Report Download - page 4
Download and view the complete annual report
Please find page 4 of the 2008 Mazda annual report below. You can navigate through the pages in the report by either clicking on the pages listed below, or by using the keyword search tool below to find specific information within the annual report.-
 1
1 -
 2
2 -
 3
3 -
 4
4 -
 5
5 -
 6
6 -
 7
7 -
 8
8 -
 9
9 -
 10
10 -
 11
11 -
 12
12 -
 13
13 -
 14
14 -
 15
15 -
16
-
17
-
18
-
19
-
20
-
21
-
22
-
23
-
24
-
25
-
26
-
27
-
28
-
29
-
30
-
31
-
32
-
33
-
34
-
35
-
36
-
37
-
38
-
39
-
40
-
41
-
42
-
43
-
44
-
45
-
46
-
47
-
48
-
49
-
50
-
51
-
52
-
53
-
54
-
55
-
56
-
57
-
58
-
59
-
60
-
61
-
62
-
63
-
64
-
65
-
66
-
67
-
68
-
69
-
70
-
71
-
72
-
73
-
74
-
75
-
76
-
77
-
78
-
79
-
80
-
81
-
82
-
83
-
84
-
85
-
86
-
87
-
88
-
89
-
90
 |
 |
¥
*
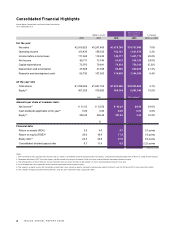
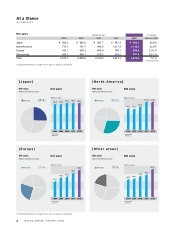
2006 2007 2008 2008 2008 vs 2007
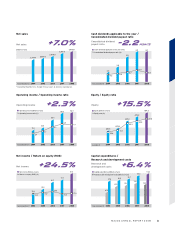
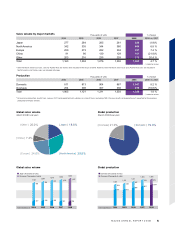
Net sales ¥2,919,823 ¥3,247,485 ¥3,475,789 $34,757,890 7.0%
Operating income 123,435 158,532 162,147 1,621,470 2.3%
Income before income taxes 117,468 118,450 143,117 1,431,170 20.8%
Net income 66,711 73,744 91,835 918,350 24.5%
Capital expenditures 72,070 79,641 75,518 755,180 (5.2)%
Depreciation and amortization 45,805 47,045 66,460 664,600 41.3%
Research and development costs 95,730 107,553 114,400 1,144,000 6.4%
Total assets ¥1,788,659 ¥1,907,752 ¥1,985,566 $19,855,660 4.1%
Equity*2 407,208 479,882 554,154 5,541,540 15.5%
Yen U.S. dollars*1
Net income*3 ¥ 51.53 ¥ 52.59 ¥ 65.21 $0.65 24.0%
Cash dividends applicable to the year*4 5.00 6.00 6.00 0.06 0.0%
Equity*5 284.28 336.45 391.82 3.92 16.5%
%
Return on assets (ROA) 3.8 4.0 4.7
0.7 points
Return on equity (ROE)*6 20.0 16.9 17.9
1.0 points
Equity ratio*6 22.3 24.8 27.8
3.0 points
Consolidated dividend payout ratio 9.7 11.4 9.2
(2.2) points