Mazda 2008 Annual Report Download - page 60
Download and view the complete annual report
Please find page 60 of the 2008 Mazda annual report below. You can navigate through the pages in the report by either clicking on the pages listed below, or by using the keyword search tool below to find specific information within the annual report.-
 1
1 -
2
-
3
-
4
-
5
-
6
-
7
-
8
-
9
-
10
-
11
-
12
-
13
-
14
-
15
-
16
-
17
-
18
-
19
-
20
-
21
-
22
-
23
-
24
-
25
-
26
-
27
-
28
-
29
-
30
-
31
-
32
-
33
-
34
-
35
-
36
-
37
-
38
-
39
-
40
-
41
-
42
-
43
-
44
-
45
-
46
-
47
-
48
-
49
-
 50
50 -
 51
51 -
 52
52 -
 53
53 -
 54
54 -
 55
55 -
 56
56 -
 57
57 -
 58
58 -
 59
59 -
 60
60 -
 61
61 -
 62
62 -
 63
63 -
 64
64 -
 65
65 -
 66
66 -
 67
67 -
 68
68 -
 69
69 -
 70
70 -
71
-
72
-
73
-
74
-
75
-
76
-
77
-
78
-
79
-
80
-
81
-
82
-
83
-
84
-
85
-
86
-
87
-
88
-
89
-
90
 |
 |

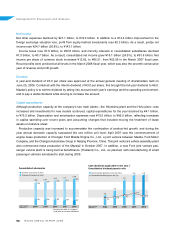
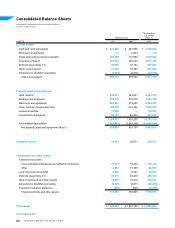
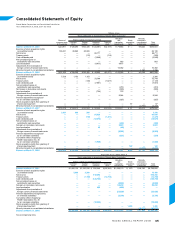
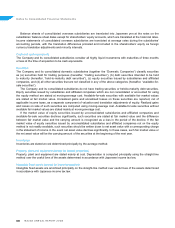
Equity as of the fiscal year-end increased ¥74.3 billion from the previous year-end, to ¥554.2 billion,
primarily from the recording of ¥91.8 billion in net income. Equity per share rose ¥55.37 (16.5%), to ¥391.82,
from ¥336.45 at the end of the previous year. Equity—calculated as net assets less minority interests and stock
acquisition rights—stood at ¥552.2 billion, for a 3.0 percentage point increase in the equity ratio, to 27.8%.
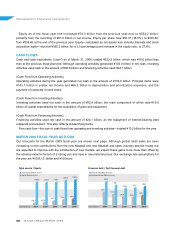
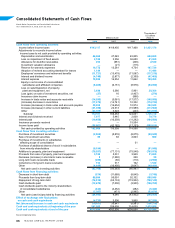
CASH FLOWS
Cash and cash equivalents (“cash”) as of March 31, 2008, totaled ¥223.9 billion, which was ¥18.6 billion less
than at the previous fiscal year-end. Although operating activities generated ¥103.0 billion in net cash, investing
activities used cash in the amount of ¥92.8 billion and financing activities used ¥24.1 billion.
(Cash Flow from Operating Activities)
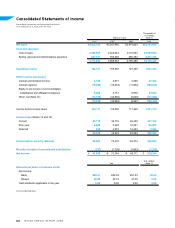
Operating activities during the year generated net cash in the amount of ¥103.0 billion. Principal items were
¥143.1 billion in pretax net income and ¥66.5 billion in depreciation and amortization expenses, and the
payment of corporate income taxes.
(Cash Flow from Investing Activities)
Investing activities used net cash in the amount of ¥92.8 billion, the main component of which was ¥79.6
billion of capital expenditures for the acquisition of plant and equipment.
(Cash Flow from Financing Activities)
Financing activities used net cash in the amount of ¥24.1 billion, as the repayment of interest-bearing debt
outpaced procurement. This also reflects dividend payments.
Free cash flow—the sum of cash flows from operating and investing activities—totaled ¥10.2 billion for the year.
MARCH 2009 FISCAL YEAR OUTLOOK
Our forecasts for the March 2009 fiscal year are shown next page. Although global retail sales are seen
increasing on the contributions from the new Mazda2 and new Mazda6 and sales volumes and the model mix
are expected to improve with the introduction of new models, we expect these gains to be more than offset by
the adverse external factors of a strong yen and rises in raw material prices. Our exchange rate assumptions for
the year are ¥100/U.S. dollar and ¥150/euro.
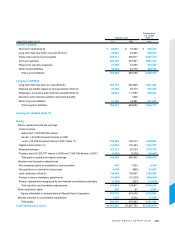
1,795.6 1,767.8 1,788.7
1,907.8 1,985.6
230.9 275.8
407.2 479.9 554.2
Total assets (Billions of yen)
Equity (Billions of yen)
(As of March 31)
630.4
528.1
455.4 474.7 505.0
358.1
313.5
246.8 232.2
281.1
Financial debt (Billions of yen)
Net financial debt (Billions of yen)
(As of March 31)