Mazda 2008 Annual Report Download - page 64
Download and view the complete annual report
Please find page 64 of the 2008 Mazda annual report below. You can navigate through the pages in the report by either clicking on the pages listed below, or by using the keyword search tool below to find specific information within the annual report.-
 1
1 -
2
-
3
-
4
-
5
-
6
-
7
-
8
-
9
-
10
-
11
-
12
-
13
-
14
-
15
-
16
-
17
-
18
-
19
-
20
-
21
-
22
-
23
-
24
-
25
-
26
-
27
-
28
-
29
-
30
-
31
-
32
-
33
-
34
-
35
-
36
-
37
-
38
-
39
-
40
-
41
-
42
-
43
-
44
-
45
-
46
-
47
-
48
-
49
-
50
-
51
-
52
-
53
-
 54
54 -
 55
55 -
 56
56 -
 57
57 -
 58
58 -
 59
59 -
 60
60 -
 61
61 -
 62
62 -
 63
63 -
 64
64 -
 65
65 -
 66
66 -
 67
67 -
 68
68 -
 69
69 -
 70
70 -
 71
71 -
 72
72 -
 73
73 -
 74
74 -
75
-
76
-
77
-
78
-
79
-
80
-
81
-
82
-
83
-
84
-
85
-
86
-
87
-
88
-
89
-
90
 |
 |

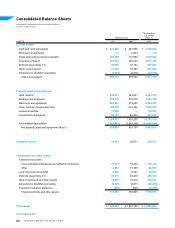
Thousands of
U.S. dollars
Millions of yen (Note 1)
ASSETS 2008 2007 2008
Current assets:
Cash and cash equivalents ¥ 223,894 ¥ 242,505 $ 2,238,940
Short-term investments 73 5,064 730
Trade notes and accounts receivable 201,259 172,958 2,012,590
Inventories (Note 5) 287,716 282,432 2,877,160
Deferred taxes (Note 13) 92,594 97,184 925,940
Other current assets 91,795 58,595 917,950
Allowance for doubtful receivables (2,019) (2,816) (20,190)
Total current assets 895,312 855,922 8,953,120
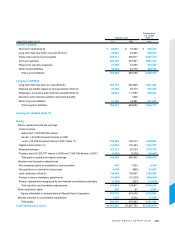
Property, plant and equipment:
Land (Note 6) 442,237 442,901 4,422,370
Buildings and structures 432,510 420,916 4,325,100
Machinery and equipment 809,447 779,645 8,094,470
Tools, furniture, fixtures and other 196,538 212,208 1,965,380
Leased properties 73,458 — 734,580
Construction in progress 25,161 46,630 251,610
1,979,351 1,902,300 19,793,510
Accumulated depreciation (1,080,983) (1,045,146) (10,809,830)
Net property, plant and equipment (Note 7) 898,368 857,154 8,983,680
Intangible assets 33,951 28,871 339,510
Investments and other assets:
Investment securities:
Unconsolidated subsidiaries and affiliated companies 87,611 79,028 876,110
Other 4,861 19,726 48,610
Long-term loans receivable 6,293 6,063 62,930
Deferred taxes (Note 13) 45,516 48,449 455,160
Other investments and other assets 18,591 16,418 185,910
Allowance for doubtful receivables (4,329) (3,271) (43,290)
Investment valuation allowance (608) (608) (6,080)
Total investments and other assets 157,935 165,805 1,579,350
Total assets ¥ 1,985,566 ¥ 1,907,752 $ 19,855,660
See accompanying notes.