Mazda 2008 Annual Report Download - page 6
Download and view the complete annual report
Please find page 6 of the 2008 Mazda annual report below. You can navigate through the pages in the report by either clicking on the pages listed below, or by using the keyword search tool below to find specific information within the annual report.-
 1
1 -
 2
2 -
 3
3 -
 4
4 -
 5
5 -
 6
6 -
 7
7 -
 8
8 -
 9
9 -
 10
10 -
 11
11 -
 12
12 -
 13
13 -
 14
14 -
 15
15 -
 16
16 -
 17
17 -
18
-
19
-
20
-
21
-
22
-
23
-
24
-
25
-
26
-
27
-
28
-
29
-
30
-
31
-
32
-
33
-
34
-
35
-
36
-
37
-
38
-
39
-
40
-
41
-
42
-
43
-
44
-
45
-
46
-
47
-
48
-
49
-
50
-
51
-
52
-
53
-
54
-
55
-
56
-
57
-
58
-
59
-
60
-
61
-
62
-
63
-
64
-
65
-
66
-
67
-
68
-
69
-
70
-
71
-
72
-
73
-
74
-
75
-
76
-
77
-
78
-
79
-
80
-
81
-
82
-
83
-
84
-
85
-
86
-
87
-
88
-
89
-
90
 |
 |

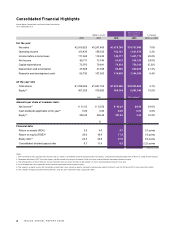
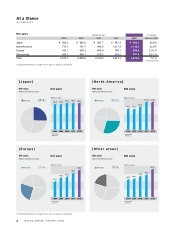
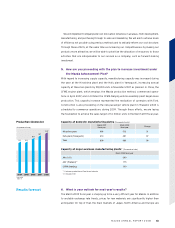
2004* 2005 2006 2007 2008 2008 vs 2007
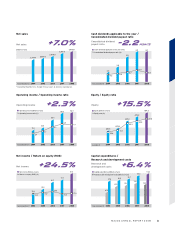
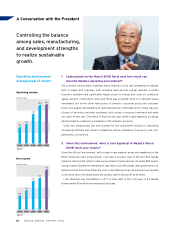
Japan ¥ 846.2 ¥ 845.6 ¥ 887.7 ¥ 887.3 ¥ 880.1 (0.8)%
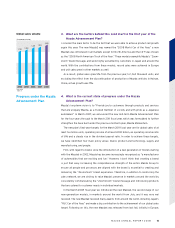
North America 772.7 761.7 844.0 1,017.9 1,015.3 (0.3)%
Europe 515.1 634.2 668.9 789.1 888.6 12.6 %
Other areas 440.7 454.1 519.2 553.2 691.8 25.1 %
Total 2,574.7 2,695.6 2,919.8 3,247.5 3,475.8 7.0 %
*
846.2
845.6
887.7
887.3
880.1
(Billions of yen)
Years ended
March 31
売上高
営業利益
売上高
営業利益
売上高
営業利益
売上高
営業利益
Net sales 25.3%
売上高
営業利益
売上高
営業利益
売上高
営業利益
売上高
営業利益
Net sales 29.2%
売上高
営業利益
売上高
営業利益
売上高
営業利益
売上高
営業利益
Net sales 25.6%
売上高
営業利益
売上高
営業利益
売上高
営業利益
売上高
営業利益
Net sales 19.9%
772.7
*
761.7
844.0
1,017.9
1,015.3
(Billions of yen)
Years ended
March 31
515.1
634.2
668.9
789.1
888.6
*
(Billions of yen)
Years ended
March 31
440.7 454.1
519.2
553.2
691.8
*
(Billions of yen)
Years ended
March 31
*