Mazda 2008 Annual Report Download - page 57
Download and view the complete annual report
Please find page 57 of the 2008 Mazda annual report below. You can navigate through the pages in the report by either clicking on the pages listed below, or by using the keyword search tool below to find specific information within the annual report.-
 1
1 -
2
-
3
-
4
-
5
-
6
-
7
-
8
-
9
-
10
-
11
-
12
-
13
-
14
-
15
-
16
-
17
-
18
-
19
-
20
-
21
-
22
-
23
-
24
-
25
-
26
-
27
-
28
-
29
-
30
-
31
-
32
-
33
-
34
-
35
-
36
-
37
-
38
-
39
-
40
-
41
-
42
-
43
-
44
-
45
-
46
-
 47
47 -
 48
48 -
 49
49 -
 50
50 -
 51
51 -
 52
52 -
 53
53 -
 54
54 -
 55
55 -
 56
56 -
 57
57 -
 58
58 -
 59
59 -
 60
60 -
 61
61 -
 62
62 -
 63
63 -
 64
64 -
 65
65 -
 66
66 -
 67
67 -
68
-
69
-
70
-
71
-
72
-
73
-
74
-
75
-
76
-
77
-
78
-
79
-
80
-
81
-
82
-
83
-
84
-
85
-
86
-
87
-
88
-
89
-
90
 |
 |
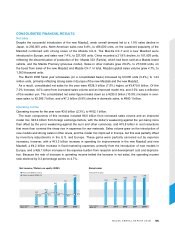
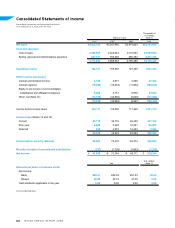
CONSOLIDATED FINANCIAL RESULTS
Net sales
Despite the successful introduction of the new Mazda2, weak overall demand led to a 1.9% sales decline in
Japan, to 256,000 units. North American sales rose 6.8%, to 406,000 units, on the sustained popularity of the
Mazda3 combined with strong sales of the Mazda CX-9. The Mazda CX-7 and a new Mazda2 were
introduced in Europe, and sales rose 7.4%, to 327,000 units. China recorded a 21.8% decline, to 101,000 units,
reflecting the discontinuation of production of the Mazda 323 (Famila), which had been sold as a Mazda brand
vehicle, and the Mazda Premacy (previous model). Sales in other markets grew 20.4%, to 273,000 units, on
the boost from sales of the new Mazda2 and Mazda CX-7. In total, Mazda’s global sales volume grew 4.7%, to
1,363 thousand units.
The March 2008 fiscal year wholesales (on a consolidated basis) increased by 63,000 units (5.4%), to 1.24
million units, primarily reflecting strong sales in Europe of the new Mazda6 and the new Mazda2.
As a result, consolidated net sales for the year were ¥228.3 billion (7.0%) higher, at ¥3,475.8 billion. Of this
7.0% increase, 4.0% came from increased sales volume and an improved model mix, and 3.0% was a reflection
of the weaker yen. The consolidated net sales figure breaks down as a ¥235.5 billion (10.0%) increase in over-
seas sales, to ¥2,595.7 billion, and a ¥7.2 billion (0.8%) decline in domestic sales, to ¥880.1 billion.
Operating income
Operating income for the year rose ¥3.6 billion (2.3%), to ¥162.1 billion.
The main components of this increase included ¥8.0 billion from increased sales volume and an improved
model mix, ¥23.4 billion from foreign exchange factors, with the dollar’s weakening against the yen being more
than offset by the yen’s weakening against the euro and other currencies, and ¥15.8 billion in cost reductions
that more than covered the sharp rise in expenses for raw materials. Sales volume grew on the introduction of
new models and strong sales in other areas, and the model mix improved in Europe, but this was partially offset
by inventory adjustments in the U.S. and Europe. These gains were partially canceled out by expense
increases, however, with a ¥13.3 billion increase in spending for improvements in the new Mazda2 and new
Mazda6, a ¥4.2 billion increase in fixed marketing expenses, primarily from the introduction of new models in
Europe, and a ¥26.1 billion increase in the expense burden from research and development cost and deprecia-
tion. Because the rate of increase in operating income trailed the increase in net sales, the operating income
ratio declined by 0.2 percentage points, to 4.7%.
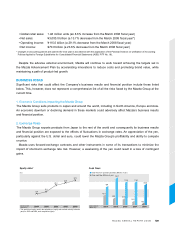
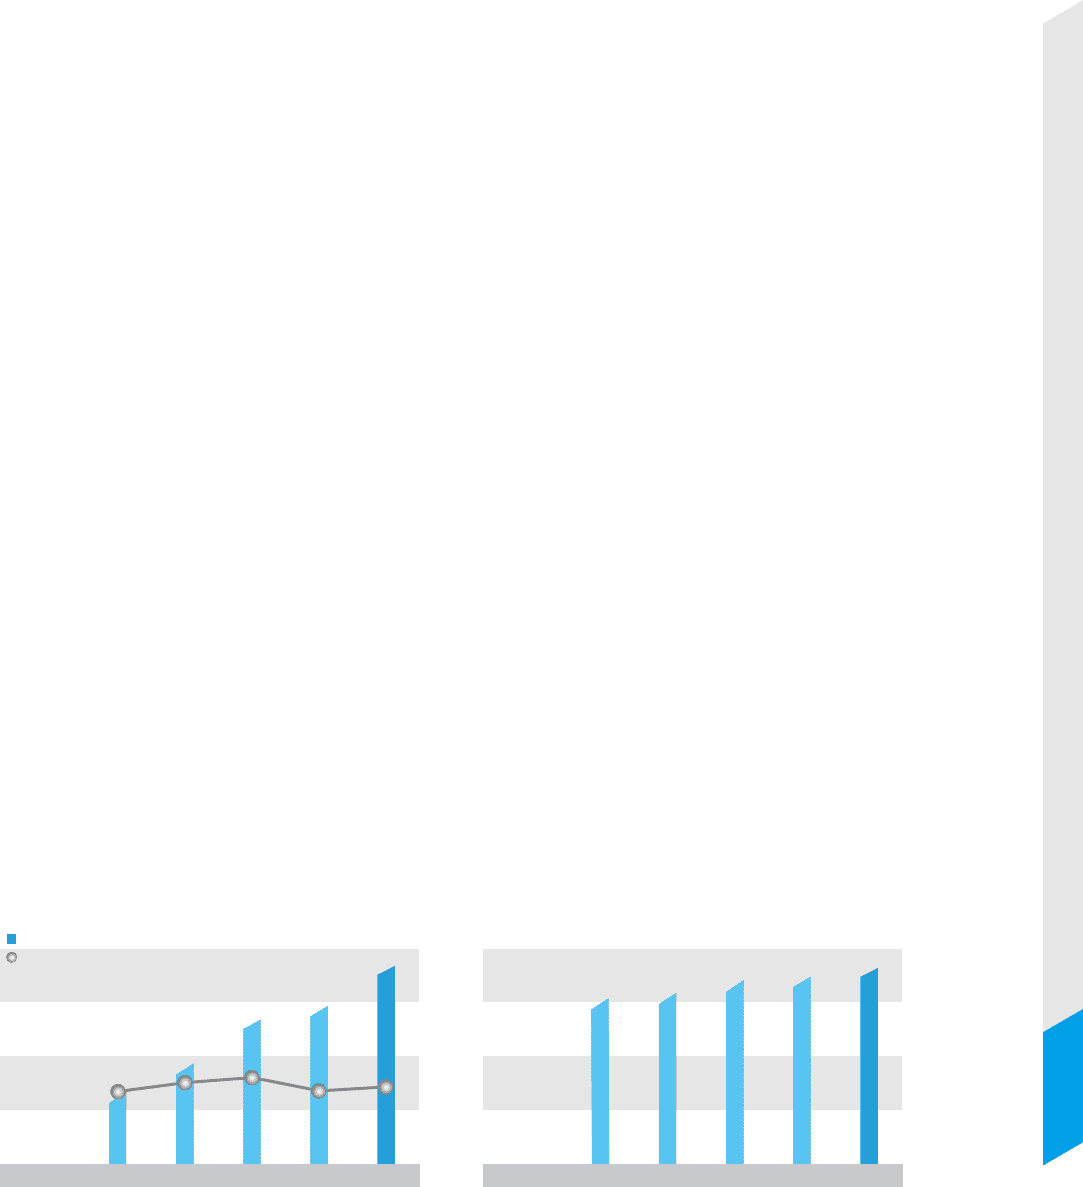
33.9
16.3 18.7 20.0 16.9 17.9
45.8
73.7
91.8
66.7
Net income (Billions of yen)
Return on equity (ROE) (%)
(Years ended
March 31)
1,163 1,204
1,302 1,363
1,276
(Years ended
March 31)
(Thousands of units)