Mazda 2008 Annual Report Download - page 5
Download and view the complete annual report
Please find page 5 of the 2008 Mazda annual report below. You can navigate through the pages in the report by either clicking on the pages listed below, or by using the keyword search tool below to find specific information within the annual report.-
 1
1 -
 2
2 -
 3
3 -
 4
4 -
 5
5 -
 6
6 -
 7
7 -
 8
8 -
 9
9 -
 10
10 -
 11
11 -
 12
12 -
 13
13 -
 14
14 -
 15
15 -
 16
16 -
17
-
18
-
19
-
20
-
21
-
22
-
23
-
24
-
25
-
26
-
27
-
28
-
29
-
30
-
31
-
32
-
33
-
34
-
35
-
36
-
37
-
38
-
39
-
40
-
41
-
42
-
43
-
44
-
45
-
46
-
47
-
48
-
49
-
50
-
51
-
52
-
53
-
54
-
55
-
56
-
57
-
58
-
59
-
60
-
61
-
62
-
63
-
64
-
65
-
66
-
67
-
68
-
69
-
70
-
71
-
72
-
73
-
74
-
75
-
76
-
77
-
78
-
79
-
80
-
81
-
82
-
83
-
84
-
85
-
86
-
87
-
88
-
89
-
90
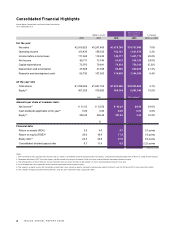
 |
 |

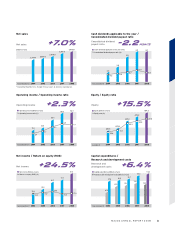
+7.0%
+2.3%
+24.5%
+15.5%
+6.4%
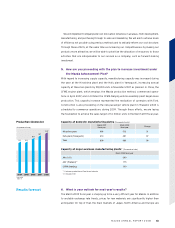
2,574.7 2,695.6
2,919.8
3,247.5
3,475.8
(Billions of yen)
*
Years ended March 31
2.4
3.1
4.2
4.9
4.7
Operating income (Billions of yen)
Operating income ratio (%)
70.2
82.9
158.5 162.1
123.4
Years ended March 31
33.9
66.7
73.7
91.8
45.8
Net income (Billions of yen)
Return on equity (ROE) (%)
16.3 18.7
20.0
16.9 17.9
Years ended March 31
2.0
7.2 8.0 9.7
11.4
3.0
5.0
6.0 6.0
9.2
Cash dividends applicable to the year (Yen)
Consolidated dividend payout ratio (%)
Years ended March 31
230.9
275.8
407.2
479.9
554.2
Equity (Billions of yen)
Equity ratio (%)
12.4
15.1
22.3
24.8
27.8
As of March 31
45.6
67.9 72.1
79.6 75.5
87.8 90.8 95.7
107.6
114.4
Capital expenditures (Billions of yen)
Research and development costs (Billions of yen)
Years ended March 31
-2.2
points
*