Mazda 2008 Annual Report Download - page 56
Download and view the complete annual report
Please find page 56 of the 2008 Mazda annual report below. You can navigate through the pages in the report by either clicking on the pages listed below, or by using the keyword search tool below to find specific information within the annual report.-
 1
1 -
2
-
3
-
4
-
5
-
6
-
7
-
8
-
9
-
10
-
11
-
12
-
13
-
14
-
15
-
16
-
17
-
18
-
19
-
20
-
21
-
22
-
23
-
24
-
25
-
26
-
27
-
28
-
29
-
30
-
31
-
32
-
33
-
34
-
35
-
36
-
37
-
38
-
39
-
40
-
41
-
42
-
43
-
44
-
45
-
 46
46 -
 47
47 -
 48
48 -
 49
49 -
 50
50 -
 51
51 -
 52
52 -
 53
53 -
 54
54 -
 55
55 -
 56
56 -
 57
57 -
 58
58 -
 59
59 -
 60
60 -
 61
61 -
 62
62 -
 63
63 -
 64
64 -
 65
65 -
 66
66 -
67
-
68
-
69
-
70
-
71
-
72
-
73
-
74
-
75
-
76
-
77
-
78
-
79
-
80
-
81
-
82
-
83
-
84
-
85
-
86
-
87
-
88
-
89
-
90
 |
 |

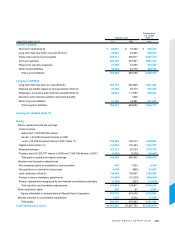
MARCH 2008 FISCAL YEAR HIGHLIGHTS
• Record profit at all levels, with a 2.3% increase in operating income, to ¥162.1 billion, and 24.5% net income
growth, to ¥91.8 billion, and seventh consecutive year of revenue and profit growth.
• Global sales grew 4.7%, to 1,363 thousand units. Excluding the effect from the discontinuation of production of
Mazda brand vehicles in Hainan, China, actual growth was 11%.
• Dividend maintained at previous year’s ¥6.0 per share.
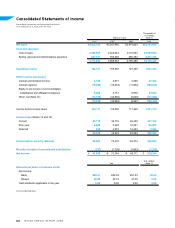
OVERVIEW OF THE MAZDA GROUP
The consolidated financial statements for the March 2008 fiscal year, include the accounts of Mazda Motor
Corporation, 58 consolidated subsidiaries (22 overseas and 36 in Japan) and 13 equity-method affiliates
(5 overseas and 8 in Japan).
BUSINESS CONDITIONS
The economic environment continued to pose many elements of risk and uncertainty for the Mazda Group both
in Japan and overseas during the March 2008 fiscal year, with unrest in international capital markets, a global
economic slowdown, and sharply higher prices for energy and crude oil. Japan’s exports to many regions
including emerging markets and oil-producing countries continued to grow, and there was an upward trend in
corporate capital investment. On the other hand, prices of domestic corporate goods and consumer prices rose
against the backdrop of high international commodity prices. There was also a trend of declining consumer
sentiment, with a drop in housing investment and weak unit sales of new cars. The effect of these factors was
further exacerbated by exchange rate fluctuations, leading to a slowdown in the domestic economy.
The automotive industry saw an extension of the replacement purchase cycle and a rise in fuel prices, and
total domestic automobile demand declined 5%, to 5.32 million units. The U.S. market also contracted 4%, to
15.84 million units, while Europe, including Russia, posted 10% growth, to 21.01 million units. The Chinese
market grew 22%, to 9.25 million units.
2,574.7 2,695.6
3,247.5 3,475.8
2,919.8
(Billions of yen)
(Years ended
March 31)
* Excluding the effect of a change in
fiscal years at overseas subsidiaries.
70.2
2.4
3.1
4.2
4.9
4.7
82.9
158.5 162.1
123.4
Operating income (Billions of yen)
Operating income ratio (%)
(Years ended
March 31)