Kia 2009 Annual Report Download - page 62
Download and view the complete annual report
Please find page 62 of the 2009 Kia annual report below. You can navigate through the pages in the report by either clicking on the pages listed below, or by using the keyword search tool below to find specific information within the annual report.-
 1
1 -
2
-
3
-
4
-
5
-
6
-
7
-
8
-
9
-
10
-
11
-
12
-
13
-
14
-
15
-
16
-
17
-
18
-
19
-
20
-
21
-
22
-
23
-
24
-
25
-
26
-
27
-
28
-
29
-
30
-
31
-
32
-
33
-
34
-
35
-
36
-
37
-
38
-
39
-
40
-
41
-
42
-
43
-
44
-
45
-
46
-
47
-
48
-
49
-
50
-
51
-
 52
52 -
 53
53 -
 54
54 -
 55
55 -
 56
56 -
 57
57 -
 58
58 -
 59
59 -
 60
60 -
 61
61 -
 62
62 -
 63
63 -
 64
64 -
 65
65 -
 66
66 -
 67
67 -
 68
68
 |
 |

REDEFINING
MOBILITY
KIA MOTORS
ANNUAL REPORT
2009
REDEFINING
MOBILITY
KIA MOTORS
ANNUAL REPORT
2009
NOTES TO NONCONSOLIDATED
FINANCIAL STATEMENTS
December 31, 2009 and 2008
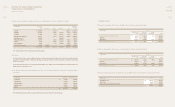
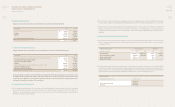
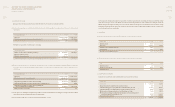
30. EARNINGS PER SHARE
Earnings per share of common stock for the years ended December 31, 2009 and 2008 are calculated as follows:
(a) Basic earnings per share are calculated by dividing net income by the weighted-average number of shares of common stock
outstanding.
For the purpose of calculating the weighted-average number of common equivalent shares outstanding, the Company assumed that ordinary
shares were issued upon exercise of the dilutive stock options at the average market price of the ordinary shares during the period. The
dierence between the number of ordinary shares issued and the number of ordinary shares that would have been issued at the average
market price (₩9,554 and ₩10,231 for the years ended 2009 and 2008, respectively) of ordinary shares during the period is considered as an
issue of ordinary shares for no consideration.
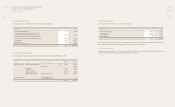
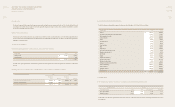
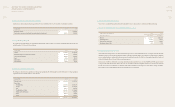
31. DIVIDENDS
(a) Details of dividends for the years ended December 31, 2009 and 2008 are as follows:
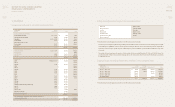
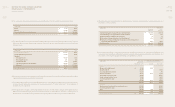
32. COMPREHENSIVE INCOME
Comprehensive income for the years ended December 31, 2009 and 2008 is as follows:
(b) Dividend yield ratios for the years ended December 31, 2009 and 2008 are as follows:
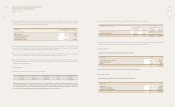
(b) Diluted earnings per share are calculated by dividing net income, as adjusted assuming all potentially dilutive stock options
have been exercised, by the weighted-average number of common shares outstanding and common equivalent shares
outstanding.
In Won, except number of shares 2009 2008
Net income ₩ 1,450,260,139,669 113,784,100,254
Weighted-average number of common shares outstanding(*) 367,279,904 346,749,691
EARNINGS PER SHARE ₩ 3,949 328
In Won, except number of shares 2009 2008
Number of common shares outstanding at January 1 ₩ 346,749,691 346,749,691
Eect of stock options exercise 58,999 -
Eect of stock warrants exercise 20,471,214 -
Weighted-average number of common shares outstanding at December 31, 2009 and 2008 ₩ 367,279,904 346,749,691
In Won, except number of shares 2009 2008
Net income ₩ 1,450,260,139,669 113,784,100,254
BW interest expense x (1 – marginal tax rate) 8,824,881,414 -
1,459,085,021,083 113,784,100,254
Weighted-average number of common shares outstanding 367,279,904 346,749,691
Weighted-average number of common equivalent shares outstanding(*1, *2) 25,405,794 20,854
Weighted-average number of common shares outstanding and
common equivalent shares outstanding 392,685,698 346,770,545
Diluted earnings per share in Won ₩ 3,716 328
(*) Weighted average number of common shares outstanding:
(*1) For the purpose of calculating the weighted-average number of common equivalent shares outstanding, the company assumed that ordinary
shares were issued upon substitute payment of bond with warranty.
(*2) 2009: 105,048-(105,048 ×8,200 ÷ 9,554) / 2008: 105,048-(105,048 ×8,200 ÷ 10,231)
In millions of Won 2009 2008
Dividend amount ₩ 96,999 -
Net income 1,450,260 113,784
Dividends as a percentage of net income 6.69% -
Par value (Won) ₩ 5,000 5,000
Dividends as a percentage of par value 5.00% -
In won 2009 2008
Dividend per share ₩ 250 -
Market price as of year end 20,050 6,550
Dividend yield ratio 1.25% -
In millions of Won 2009 2008
NET INCOME ₩ 1,450,260 113,784
Change in fair value of available-for-sale securities, net of tax (27) 9
Unrealized holding gain on equity method accounted investments, net of tax (17,072) 255,520
Unrealized holding loss on equity method accounted investments, net of tax 77,328 (2,713)
Eective portion of changes in fair value of cash ow hedges, net of tax 11,029 (7,473)
Eective portion of changes resulting from the changes in currency exchange rate of
non-derivative nancial instrument, net of tax 40,734 (99,863)
Revaluation surplus, net of tax (517) 1,005,340
COMPREHENSIVE INCOME ₩ 1,561,735 1,264,604