Kia 2009 Annual Report Download - page 3
Download and view the complete annual report
Please find page 3 of the 2009 Kia annual report below. You can navigate through the pages in the report by either clicking on the pages listed below, or by using the keyword search tool below to find specific information within the annual report.-
 1
1 -
 2
2 -
 3
3 -
 4
4 -
 5
5 -
 6
6 -
 7
7 -
 8
8 -
 9
9 -
 10
10 -
 11
11 -
 12
12 -
 13
13 -
 14
14 -
15
-
16
-
17
-
18
-
19
-
20
-
21
-
22
-
23
-
24
-
25
-
26
-
27
-
28
-
29
-
30
-
31
-
32
-
33
-
34
-
35
-
36
-
37
-
38
-
39
-
40
-
41
-
42
-
43
-
44
-
45
-
46
-
47
-
48
-
49
-
50
-
51
-
52
-
53
-
54
-
55
-
56
-
57
-
58
-
59
-
60
-
61
-
62
-
63
-
64
-
65
-
66
-
67
-
68
 |
 |

FINANCIAL HIGHLIGHTS
2009 2008 2007 2006 2005
SALES VOLUME (Units) 1,142,038 1,056,400 1,114,451 1,140,734 1,105,841
Korea 411,332 315,276 271,809 269,575 265,825
Export (excluding CKD) 730,706 741,124 842,642 871,159 840,016
SUMMARIZED BALANCE SHEET (KRW in millions)
Total Assets 16,941,596 15,452,278 12,853,763 12,106,605 11,241,785
Current Assets 4,308,703 3,538,455 3,237,924 3,122,252 2,915,901
Non-current Assets 12,632,893 11,913,823 9,615,839 8,984,353 8,325,884
Total Liabilities 9,565,201 9,710,996 7,778,421 6,858,849 5,989,417
Debt 4,560,482 5,633,275 4,161,801 2,940,149 2,046,040
[Short term] 1,814,890 2,176,622 1,507,725 1,162,106 571,256
[Long term] 2,745,592 3,456,653 2,654,076 1,778,043 1,474,784
Total Shareholders’ Equity 7,376,395 5,741,282 5,075,342 5,247,756 5,252,368
Total Asset Growth 9.64% 20.22% 6.17% 7.69% 5.20%
SUMMARIZED INCOME STATEMENT (KRW in millions)
Revenue 18,415,739 16,382,231 15,948,542 17,439,910 15,999,356
Operating Income 1,144,473 308,533 (55,404) (125,291) 74,002
Ordinary Income 1,699,577 67,772 24,968 73,213 689,405
Net Income 1,450,260 113,784 13,563 39,337 680,904
Revenue Growth 12.41% 2.72% -8.55% 9.00% 4.86%
Net Income Growth 1,174.57% 738.93% -65.52% -94.22% 2.85%
RATIO (%)
Total Liabilities/Equity 129.67% 169.14% 153.26% 130.70% 114.03%
Total Debt/Equity 61.83% 98.12% 82.00% 56.03% 38.95%
Net Income/Revenue 7.88% 0.69% 0.09% 0.23% 4.26%
EPS (KRW) 3,949 328 39 114 1,967
SUMMARIZED CASH FLOWS (KRW in millions)
Cash ows from operating activities 2,499,220 799,643 28,240 (231,550) 438,760
Cash ows from investing activities (1,229,455) (1,687,324) (920,367) (961,061) (646,346)
Cash ows from nancing activities (739,606) 1,112,642 1,057,430 807,495 323,793
Cash and cash equivalents, beginning of year 911,872 686,911 521,608 906,724 790,517
Net increase (decrease) 530,159 224,961 165,303 (385,116) 116,207
Cash and cash equivalents, end of year 1,442,031 911,872 686,911 521,608 906,724
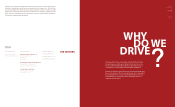
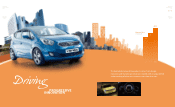
Driving is all about the essential human thrill of mobility. People
love going places, and Kia loves taking them there. Our cars are
fun, safe and dependable. Most important, they demonstrate a
commitment to sustainability, both from drivers and from us.
Because we understand so well the value our products bring to the
lives of our customers, Kia has once again been able to outperform
the competition. From concept and design through to execution
and marketing, Kia’s innovative spirit is winning the hearts of
customers the world over.
WHY
DO WE
DRIVE
?
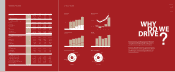
2009 AT A GLANCE
(thousand units)
PRODUCTION RATE BY PLANT RETAIL SALES BY REGION
(KRW in billions, %)
Operating Prot
% of Revenue
20072006 20092008
1,150
120
1,106
2005
110
1,531
1,270
1,395
1,216
1,370
OVERSEAS PLANTS
KOREA PLANTS
GLOBAL RETAIL SALES
(thousand units)
1,225
2008
1,375
2009
1,651
1,269
20072006
1,187
2005
REVENUE
(KRW in billions)
15,949
2007
18,416
2009
17,440
2006
16,382
2008
15,999
2005
6.2%
1.9%
0.3%
0.7%
0.5%
1,145
2009
309
2008
(55)
2007
(125)
2007
74
2005
(Total production:
1,531 thousand units)
(Total retail sales:
1,651 thousand units)
KOREA PLANTS
74.3%
SLOVAKIA PLANTS
9.8%
CHINA PLANTS
15.9%
2009 US
18.2%
CHINA
14.6%
EUROPE
20.1%
REST OF WORLD
22.2%
KOREA
24.9% 2009
1,137
394
1,055
340
1,119
251
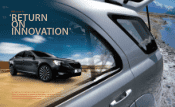
REDEFINING
MOBILITY
KIA MOTORS
ANNUAL REPORT
2009