Kia 2009 Annual Report Download - page 35
Download and view the complete annual report
Please find page 35 of the 2009 Kia annual report below. You can navigate through the pages in the report by either clicking on the pages listed below, or by using the keyword search tool below to find specific information within the annual report.-
 1
1 -
2
-
3
-
4
-
5
-
6
-
7
-
8
-
9
-
10
-
11
-
12
-
13
-
14
-
15
-
16
-
17
-
18
-
19
-
20
-
21
-
22
-
23
-
24
-
 25
25 -
 26
26 -
 27
27 -
 28
28 -
 29
29 -
 30
30 -
 31
31 -
 32
32 -
 33
33 -
 34
34 -
 35
35 -
 36
36 -
 37
37 -
 38
38 -
 39
39 -
 40
40 -
 41
41 -
 42
42 -
 43
43 -
 44
44 -
 45
45 -
46
-
47
-
48
-
49
-
50
-
51
-
52
-
53
-
54
-
55
-
56
-
57
-
58
-
59
-
60
-
61
-
62
-
63
-
64
-
65
-
66
-
67
-
68
 |
 |

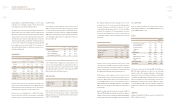
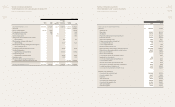
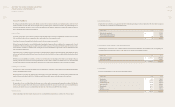
NONCONSOLIDATED
STATEMENTS OF INCOME
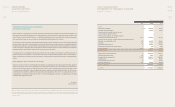
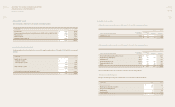
NONCONSOLIDATED
STATEMENTS OF FINANCIAL POSITION
Sales 9,35 ₩ 18,415,739 16,382,231
Cost of sales 9 13,824,362 13,018,054
GROSS PROFIT 4,591,377 3,364,177
Selling, general and administrative expenses 28 3,446,904 3,055,644
OPERATING INCOME 1,144,473 308,533
Interest income 132,273 134,945
Interest expense (343,960) (327,226)
Foreign currency translation gain (loss), net 2,208 (241,248)
Foreign currency transaction loss, net (71,300) (103,221)
Loss on scrapped inventories (5,300) (1,768)
Dividend income 1,007 298
Equity in earnings of equity method accounted investees, net 8 813,703 547,690
Loss on sale of accounts and notes receivable - trade (87,540) (102,526)
Impairment loss on investments (689) -
Gain on disposition of investments 58,306 5,538
Loss on retirement of bonds (164) -
Loss on valuation of investment securities - (6,320)
Gain (loss) on valuation of derivatives, net 23 (2,973) 36,288
Loss on sale of property, plant and equipment, net (22,065) (9,593)
Loss on revaluation of land - (2,949)
Other, net 81,598 (170,669)
OTHER INCOME EXPENSE 555,104 (240,761)
INCOME BEFORE INCOME TAXES 1,699,577 67,772
Income taxes (benet) 29 249,317 (46,012)
NET INCOME
₩ 1,450,260 113,784
EARNINGS PER SHARE
Basic earnings per share in Won 30 ₩ 3,949 328
Diluted earnings per share in Won 30 ₩ 3,716 328
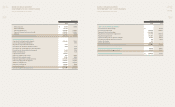
LIABILITIES
Accounts and notes payable - trade 9,19 ₩ 2,404,887 1,807,464
Short-term borrowings 15,19 79,453 1,287,041
Provision for warranties - current 20 227,515 290,892
Accounts and notes payable - other 9,19 759,941 788,242
Income taxes payable 29 21,511 -
Current portion of long-term debt, less discount
of ₩510 in 2009 and ₩474 in 2008 13,16,19 1,655,222 805,830
Current portion of capital lease obligation 18 80,215 83,751
Other current liabilities 14 616,882 131,144
Total current liabilities 5,845,626 5,194,364
Long-term debt, less discount of ₩7,726 in 2009 and ₩3,618 in 2008 13,17,19 2,745,592 3,376,438
Capital lease obligation 18 - 80,215
Provision for warranties 20 371,615 446,171
Accrual for retirement and severance benets 21 327,881 491,610
Non-current deferred tax liabilities, net 29 160,189 -
Other non-current liabilities 17 114,298 122,198
Total non-current liabilities 3,719,575 4,516,632
Total liabilities 9,565,201 9,710,996
EQUITY
Common stock of ₩5,000 par value Authorized - 820,000,000 shares
Issued - 388,371,048 shares in 2009 and 347,230,455 shares in 2008
Outstanding - 387,995,332 shares in 2009 and 346,749,691 shares in 2008 24 2,054,355 1,848,652
Capital surplus 25 1,761,403 1,704,583
Capital adjustments 24,27 (2,249) (2,427)
Accumulated other comprehensive income (loss) 23,32 1,197,566 1,086,091
Retained earnings 26 2,365,320 1,104,383
Total equity 7,376,395 5,741,282
Total liabilities and equity ₩ 16,941,596 15,452,278
IN MILLIONS OF WON, EXCEPT EARNING PER SHAREIN MILLIONS OF WON, EXCEPT SHARE DATA
Note 2009 2008
Note 2009 2008
For the years ended December 31, 2009 and 2008As of December 31, 2009 and 2008
REDEFINING
MOBILITY
KIA MOTORS
ANNUAL REPORT
2009
REDEFINING
MOBILITY
KIA MOTORS
ANNUAL REPORT
2009