Kia 2009 Annual Report Download - page 29
Download and view the complete annual report
Please find page 29 of the 2009 Kia annual report below. You can navigate through the pages in the report by either clicking on the pages listed below, or by using the keyword search tool below to find specific information within the annual report.-
 1
1 -
2
-
3
-
4
-
5
-
6
-
7
-
8
-
9
-
10
-
11
-
12
-
13
-
14
-
15
-
16
-
17
-
18
-
 19
19 -
 20
20 -
 21
21 -
 22
22 -
 23
23 -
 24
24 -
 25
25 -
 26
26 -
 27
27 -
 28
28 -
 29
29 -
 30
30 -
 31
31 -
 32
32 -
 33
33 -
 34
34 -
 35
35 -
 36
36 -
 37
37 -
 38
38 -
 39
39 -
40
-
41
-
42
-
43
-
44
-
45
-
46
-
47
-
48
-
49
-
50
-
51
-
52
-
53
-
54
-
55
-
56
-
57
-
58
-
59
-
60
-
61
-
62
-
63
-
64
-
65
-
66
-
67
-
68
 |
 |

REDEFINING
MOBILITY
KIA MOTORS
ANNUAL REPORT
2009
REDEFINING
MOBILITY
KIA MOTORS
ANNUAL REPORT
2009
51 Management’s Discussion & Analysis
60 Independent Auditors’ Report
61 Non-Consolidated Statements of Financial Position
63 Non-Consolidated Statements of Income
64 Non-Consolidated Statements of Appropriation of Retained Earnings
65 Non-Consolidated Statements of Changes in Equity
67 Non-Consolidated Statements of Cash Flows
70 Notes to Non-Consolidated Financial Statements
120 Independent Accountants’ Review Report on Internal Accounting Control System
121 Report on the Operations of Internal Accounting Control System
MANAGEMENT’S
DISCUSSION & ANALYSIS
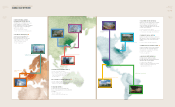
OPERATING REVIEW
The contraction in worldwide auto demand that followed the
onset of the global financial crisis continued throughout 2009.
Vehicle sales remained weak in all major markets, including the
US, Europe and China.
Kia Motors’ export volume for 2009 therefore shrank year-on-
year, due also in part to inventory adjustments at our overseas
lots. Nevertheless, the company’s total ex-factory sales were up
9.6% over 2008, thanks to surging domestic demand. Driven by
favorable tax incentives and a strong response to the launch of
our latest models, sales in Korea recorded 1.142 million units, an
8.1% increase year-on-year.
Our overseas factories sold 392,000 units, up 14.2%. The top-
performing foreign market was China, which recorded a 70.0% rise
in volume to 241,000 units. The European plants, however, posted
a 25.2% fall to 150,000 units, attributable mainly to the extended
economic diculties in Eastern Europe.
Globally, ex-factory sales were up 9.6% in 2009. This rise was
dwarfed by the large increase in retail sales, however, which grew
by 20.1%, and is particularly impressive in light of the widespread
hardships faced by the majority of the world’s automakers last
year.
The economic downturn has been an excellent opportunity for
Kia Motors to improve the company’s brand recognition and
emphasize the high value-for-money oered by our automotive
products. Although our price competitiveness has been eroded
somewhat by the increasing value of the Korean won, we
nonetheless expect the rising sales trend to continue. We have
used the past year to leverage our marketing advantages with
a stronger dealer network and well-prepared launches of new
automobiles. On the operations side, Kia has streamlined its
inventory management while expanding its product line, and is
therefore well-positioned to continue building market share in
this challenging economic environment.
DOMESTIC SALES AND STRATEGIES
Despite serious financial difficulties faced by GM Daewoo and
SsangYong Motor, Kia’s major domestic competitors, the Korean
market posted its strongest annual sales since 2002, recording
a 17.6% rise to 1,465,697 units in 2009. This increase followed
determined measures by the Korean government to support
automakers with consumption tax breaks and favorable tax
treatment for trade-ins of older vehicles. All major domestic
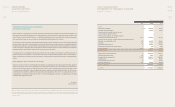
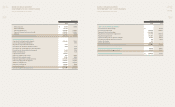
FINANCIAL
REVIEW
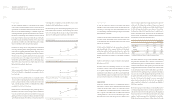
(thousand units)
Ex-factory Sales 2008 2009 Chg (%)
Domestic 315 411 30.5%
Export 741 731 -1.4%
Korean factories 1,056 1,142 8.1%
China 142 241 70.0%
Slovakia 201 150 -25.2%
Overseas factories 343 392 14.2%
Total 1,399 1,534 9.6%
* Figures based on shipment and revenue
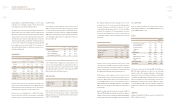
(thousand units)
Retail Sales 2008 2009 Chg (%)
Korea 315 411 30.5%
US 273 300 9.8%
W. Europe 225 242 7.7%
China 142 241 70.0%
Rest of World 419 455 8.7%
Canada 38 46 22.9%
Latin America 77 78 0.6%
E. Europe 110 89 -18.8%
Middle East/ Africa 141 188 33.5%
Asia Pacic 53 54 1.9%
Total 1,375 1,651 20.1%
* W. Europe: EU+EFTA countries
EXFACTORY SALES
RETAIL SALES