Kia 2009 Annual Report Download - page 54
Download and view the complete annual report
Please find page 54 of the 2009 Kia annual report below. You can navigate through the pages in the report by either clicking on the pages listed below, or by using the keyword search tool below to find specific information within the annual report.-
 1
1 -
2
-
3
-
4
-
5
-
6
-
7
-
8
-
9
-
10
-
11
-
12
-
13
-
14
-
15
-
16
-
17
-
18
-
19
-
20
-
21
-
22
-
23
-
24
-
25
-
26
-
27
-
28
-
29
-
30
-
31
-
32
-
33
-
34
-
35
-
36
-
37
-
38
-
39
-
40
-
41
-
42
-
43
-
 44
44 -
 45
45 -
 46
46 -
 47
47 -
 48
48 -
 49
49 -
 50
50 -
 51
51 -
 52
52 -
 53
53 -
 54
54 -
 55
55 -
 56
56 -
 57
57 -
 58
58 -
 59
59 -
 60
60 -
 61
61 -
 62
62 -
 63
63 -
 64
64 -
65
-
66
-
67
-
68
 |
 |

REDEFINING
MOBILITY
KIA MOTORS
ANNUAL REPORT
2009
REDEFINING
MOBILITY
KIA MOTORS
ANNUAL REPORT
2009
NOTES TO NONCONSOLIDATED
FINANCIAL STATEMENTS
December 31, 2009 and 2008
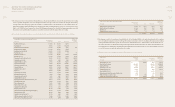
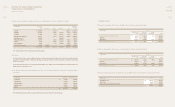
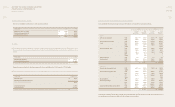
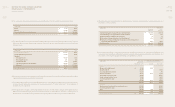
(c) Changes in property, plant and equipment for the year ended December 31, 2008 are summarized as follows:
(*) ₩ 1,349,414 million in “other” of land was increased by revaluation.
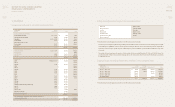
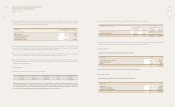
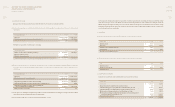
(d) Insurance
As of December 31, 2009, inventories, buildings, structures, machinery and equipment and dies, molds and tools were insured against re
damage up to ₩ 4,095,387 million. In addition, the Company carries general insurance for vehicles and workers’ compensation and casualty
insurance for employees.
The Company maintains insurance to cover potential product liabilities up to USD 85,000 thousand in North America and Europe and ₩ 1,000
million in Korea as of December 31, 2009.
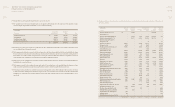
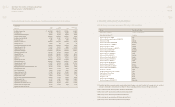
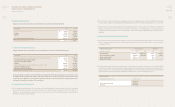
(e) The ocially declared value of land at December 31, 2009, as announced by the Minister of Construction and Transportation,
is as follows:
In millions of Won Book value as Book value as
January of December
1, 2008 Acquisitions Disposals Depreciation Other 31, 2008
Land (*) ₩ 1,386,460 - (3,504) - 1,349,414 2,732,370
Buildings 1,046,741 - (3,549) (43,200) 80,426 1,080,418
Structures 213,606 - (555) (20,292) 34,167 226,926
Machinery and equipment 1,608,112 - (9,715) (200,014) 248,467 1,646,850
Capital lease asset 242,864 - - (24,154) - 218,710
Dies, molds and tools 250,395 - (1,881) (116,544) 94,510 226,480
Vehicles 40,347 - (5,944) (13,019) 26,957 48,341
Other equipment 51,275 - (29) (22,886) 12,430 40,790
Construction-in- progress 435,381 356,643 - - (560,422) 231,602
₩ 5,275,181 356,643 (25,177) (440,109) 1,285,949 6,452,487
In millions of Won Book value Declared value(*)
Head oce ₩ 575,035 476,034
Sohari factory 826,416 580,720
Hwasung factory 673,511 452,338
Kwangju factory 406,271 290,319
Others 249,939 207,461
₩ 2,731,172 2,006,872
(*)The ocially declared value, which is used for government purposes, is not intended to represent fair value.
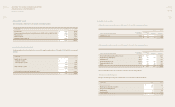
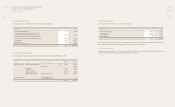
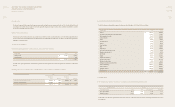
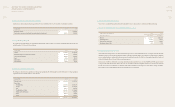
11. INTANGIBLE ASSETS
(a) Changes in intangible assets for the year ended December 31, 2009 are summarized as follows:
(b) Changes in intangible assets for the year ended December 31, 2008 are summarized as follows:
In millions of Won 2009
Development Industrial Facility
costs property rights usage
rights Total
NET BALANCE AT BEGINNING OF YEAR ₩ 963,547 6,573 1,775 971,895
Additions 355,167 1,233 - 356,400
Amortization (251,337) (1,494) (1,354) (254,185)
NET BALANCE AT END OF YEAR ₩ 1,067,377 6,312 421 1,074,110
In millions of Won 2008
Development Industrial Facility
costs property rights usage
rights Total
NET BALANCE AT BEGINNING OF YEAR ₩ 853,170 6,396 3,641 863,207
Additions 382,063 1,716 - 383,779
Amortization (271,686) (1,539) (1,866) (275,091)
NET BALANCE AT END OF YEAR ₩ 963,547 6,573 1,775 971,895
(c) Research and development costs incurred for the years ended December 31, 2009 and 2008 are summarized as follows:
In millions of Won 2009 2008
Development cost ₩ 355,167 382,063
Cost of sales 96,866 99,423
Selling, general and administrative expenses 262,623 266,635
₩ 714,656 748,121