Kia 2009 Annual Report Download - page 49
Download and view the complete annual report
Please find page 49 of the 2009 Kia annual report below. You can navigate through the pages in the report by either clicking on the pages listed below, or by using the keyword search tool below to find specific information within the annual report.-
 1
1 -
2
-
3
-
4
-
5
-
6
-
7
-
8
-
9
-
10
-
11
-
12
-
13
-
14
-
15
-
16
-
17
-
18
-
19
-
20
-
21
-
22
-
23
-
24
-
25
-
26
-
27
-
28
-
29
-
30
-
31
-
32
-
33
-
34
-
35
-
36
-
37
-
38
-
 39
39 -
 40
40 -
 41
41 -
 42
42 -
 43
43 -
 44
44 -
 45
45 -
 46
46 -
 47
47 -
 48
48 -
 49
49 -
 50
50 -
 51
51 -
 52
52 -
 53
53 -
 54
54 -
 55
55 -
 56
56 -
 57
57 -
 58
58 -
 59
59 -
60
-
61
-
62
-
63
-
64
-
65
-
66
-
67
-
68
 |
 |

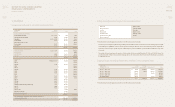
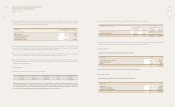
The Company accounted for its all investment by using equity method of accounting based on the unaudited nancial statements as it was
unable to obtain the audited nancial statements and performed procedures to verify the unaudited nancial statements.
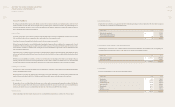
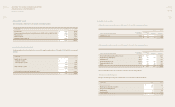
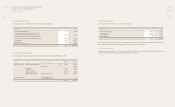
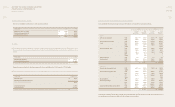
(*1) The cumulative income (losses) and unrealized gains not recognized by the Company due to the suspension of the valuation of equity
securities using the equity method as of December 31, 2008 consist of the following
(*2) Investments in associates are recorded at cost, except where the eect of applying the equity method of accounting for investments on the
non-consolidated nancial statements is material.
(*3) The Company made additional investment in Kia Motors America Inc, Kia Motors Deutschland GmbH and Kia Motors Europe GmbH during
the year. However, as noted above, the equity method was discontinued as the Company’s share of losses exceeded the carrying amount of
the investment. In accordance with the equity method of accounting, the Company’s additional investment is recognized as a decrease of
retained earnings, as the cumulative losses are greater than the Company’s additional investment.
(*4) The Company reclassied equity interest in HMC Investment Securities Co., Ltd. from available-for- sale securities to equity method securities
as the Company and its holding company, Hyundai Motor Company, together own more than 20%.
(*5) Other decrease consists of dividends from associates companies except for Kia Motors Deutschland GmbH, Kia Motors Europe GmbH (as
noted in *3 above) and HMC Investment Securities Co., Ltd. (as noted in *4 above)
(*6) The Company made an adjustment to conform the associates’ accounting policies to those of the Company for like transactions and events in
similar circumstances. Relating to this adjustment, equity in earnings of aliates has been reduced by ₩ 21,103 million and unrealized holding
gain on equity method accounted investments has been increased by ₩ 84,164 million for the year ended December 31, 2008, respectively.
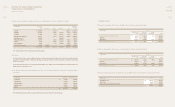
(h) The market price of equity investments in listed associates companies as of December 31, 2009 and 2008 are as follows:
NOTES TO NONCONSOLIDATED
FINANCIAL STATEMENTS
December 31, 2009 and 2008
In millions of Won
Cumulative Unrealized
Company income(losses) gains
Kia Motors America, Inc. ₩ 144,117 (281,009)
Kia Canada Inc. (103,224) (12,604)
Kia Motors Europe GmbH 57,326 (75,895)
Kia Motors Australia Pty Ltd. (63,789) (12,853)
₩ 34,430 (382,361)
In millions of Won
Company
2009 2008
Hyundai Mobis Co., Ltd. ₩ 2,660,439 981,717
Hyundai Hysco Co., Ltd. 188,514 83,102
Hyundai Steel Company 1,570,798 682,798
Hyundai Autonet Co., Ltd. - 51,940
Hyundai Investment Securites Co., Ltd 23,411 7,723
₩ 4,443,162 1,807,280
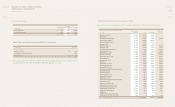
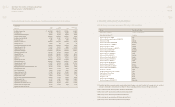
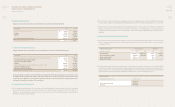
(i) Summarized nancial information of the investees as of and for the year ended December 31, 2009 is as follows:
In millions of Won
Total Total Net income
Company assets liabilities Sales (loss)
Kia Motors America, Inc. ₩ 4,260,207 4,112,141 5,953,234 (139,731)
Kia Canada Inc. 165,035 234,174 1,176,573 41,354
Kia Motors Deutschland GmbH 703,110 618,880 1,302,757 47,035
Kia Motors Europe GmbH 3,078,993 3,502,571 5,701,474 (563,426)
Kia Motors Australia Pty Ltd. 142,702 180,127 433,681 (7,067)
Kia Tigers Co., Ltd. 3,956 4,560 25,492 (33)
Kia Motors Slovakia s.r.o. 2,839,718 2,068,891 2,989,067 46,018
Kia Japan Co., Ltd. 29,252 147 1,376 (22)
Dongfeng Yueda Kia Motors Co., Ltd. 1,941,749 1,334,429 3,800,855 136,279
Haevichi Resort Co., Ltd. 352,379 322,293 49,115 992
Hyundai Mobis Co., Ltd. 11,106,365 3,339,531 10,633,020 1,615,220
Hyundai Steel Company 15,401,749 8,973,935 7,966,444 11,519,970
Hyundai Powertech Co., Ltd. 1,382,198 918,240 1,304,903 39,649
Hyundai WIA Corp. 2,277,700 1,457,510 3,118,249 72,218
Hyundai Card Co., Ltd. 7,352,490 5,857,366 1,840,842 222,391
Dymos Inc. 865,598 561,574 905,926 15,387
Hyundai Hysco Co., Ltd. 2,926,589 1,773,368 4,423,311 54,395
EUKOR Car Carriers, Inc. 2,192,606 1,604,475 2,058,808 68,648
Hyundai AMCO Co.,Ltd. 813,195 405,258 1,081,273 45,428
Beijing Hyundai Mobis Automotive Parts Co., Ltd. 303,319 104,860 375,185 29,335
China Millennium Corp. 117,079 63,311 24,008 4,092
Partecs Company, Ltd. 102,431 56,275 33,569 5,497
Autoever Systems Co., Ltd. 253,567 146,480 537,040 27,217
Hyundai-Motor Group Ltd. 401,462 262,722 1,550,027 71,302
Donghee Auto Co., Ltd. 126,521 95,742 129,513 3,581
WIA Automotive Engine (Shandong) Company 474,755 227,341 231,359 8,968
TRW Steering Co., Ltd. 91,050 68,529 155,218 (279)
Haevichi Country Club., Ltd. 281,392 262,314 11,307 (4,957)
HMC Investment Securities Co., Ltd. 1,922,907 1,349,438 271,440 28,368
The Korea Economic Daily Co., Ltd. 188,058 65,402 118,778 8,578
HMC Win-Win Cooperation Fund 31,011 - 1,335 946
EUKOR Shipowning Singapore Pte. Ltd. 112,251 94,763 33,234 33,177
REDEFINING
MOBILITY
KIA MOTORS
ANNUAL REPORT
2009
REDEFINING
MOBILITY
KIA MOTORS
ANNUAL REPORT
2009