Kia 2009 Annual Report Download - page 32
Download and view the complete annual report
Please find page 32 of the 2009 Kia annual report below. You can navigate through the pages in the report by either clicking on the pages listed below, or by using the keyword search tool below to find specific information within the annual report.-
 1
1 -
2
-
3
-
4
-
5
-
6
-
7
-
8
-
9
-
10
-
11
-
12
-
13
-
14
-
15
-
16
-
17
-
18
-
19
-
20
-
21
-
 22
22 -
 23
23 -
 24
24 -
 25
25 -
 26
26 -
 27
27 -
 28
28 -
 29
29 -
 30
30 -
 31
31 -
 32
32 -
 33
33 -
 34
34 -
 35
35 -
 36
36 -
 37
37 -
 38
38 -
 39
39 -
 40
40 -
 41
41 -
 42
42 -
43
-
44
-
45
-
46
-
47
-
48
-
49
-
50
-
51
-
52
-
53
-
54
-
55
-
56
-
57
-
58
-
59
-
60
-
61
-
62
-
63
-
64
-
65
-
66
-
67
-
68
 |
 |

REDEFINING
MOBILITY
KIA MOTORS
ANNUAL REPORT
2009
REDEFINING
MOBILITY
KIA MOTORS
ANNUAL REPORT
2009
MANAGEMENT’S
DISCUSSION & ANALYSIS
plant’s utilization and profitability will improve in 2010 to push
production close to the plant’s capacity of 300,000 units per year
as we ramp up cross-production of Hyundai vehicles.
Kia’s plant in the US state of Georgia, which began construction in
the last quarter of 2006, was completed in late 2009. This plant will
allow Kia to respond much more quickly and flexibly to market
changes in the US, and raise the company’s prole in the world’s
most important auto market. Commercial production of all-new
Sorento began in November, and total 2010 scheduled production
is 130,000 units. As with the Slovakia plant, the Georgia plant will
be steadily geared up to achieve its full 300,000 units per year
capacity through introduction of additional models and cross-
production with Hyundai.
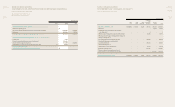
PROFITABILITY
Domestic sales in 2009 posted a sharp increase thanks to the
introduction of new models and auto sector stimulus measures
prepared by the Korean government. Total sales amounted to
1.142 million units, a gain of 8.1% over the previous year.
Revenues also rose, climbing 12.4% to KRW 18.416 trillion.
Revenues earned from domestic sales were up by an even higher
margin, rising 30.5%, which pushed total revenues up by more
than KRW 1 trillion.
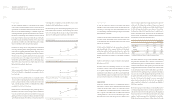
The company’s average selling price (ASP), measured in US
dollars, recorded a decline due to the lower proportion of RVs in
the 2009 sales mix and a greater portion of small-sized vehicles..
This resulted in sales revenue reduction of approximately KRW 50
million but was partially oset by the rising value of the Korean
won, which gained approximately 12% against the US dollar over
the course of the year.
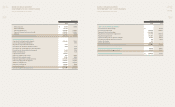
ASP
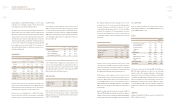
Gross prot and gross margin climbed substantially in 2009 due
to the combined effects of higher sales volume, improved cost
structure and a strengthening local currency. Gross profit as a
share of revenues rose from 20.5% in 2008 to 24.9% in 2009, while
operating prot margin reached 6.2% of sales, rising above KRW 1
trillion for the rst time in Kia Motors’ history.
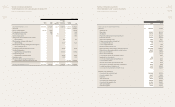
COGS AND SG&A
COGS as a share of revenue declined from 79.5% in 2008 to 75.1%
in 2009 due to the stronger Korean currency combined with
falling raw materials costs and Technical Cost Innovation (TCI) to
improve overall protability.
The company’s SG&A ratio remained unchanged at 18.7%. Sales
and promotion costs to clear excess inventory during the global
economic downturn rose from 3.4% of revenue to 5.0% year-
on-year, while warranty expenses fell to 1.1% due to the higher
proportion of new vehicles sold. Per-unit guarantee costs were
reduced as the warranty period ended for certain high-cost
vehicles while guarantee expenses benefited from the stronger
Korean won.
NONOPERATING PROFIT
Income before income tax and net income in 2009 set new
company records at KRW 1.7 trillion and KRW 1.45 trillion,
respectively. The gains were helped by higher non-operating
earnings, including gains on investments accounted for by using
the equity method, and reduced foreign exchange losses.
While total year-end borrowings recorded a decline in 2009,
a higher average volume of borrowings throughout the year
resulted in a KRW 19 billion increase in net interest expense to
close at KRW 212 billion. Losses on forex transactions showed
substantial improvement, from KRW 308 billion in 2008 to KRW 72
billion in 2009. The change was due mainly to the rising value of
the Korean won.
Gains from equity method investments amounted to KRW 814
billion, up KRW 266 billion from the previous year due to improved
earnings of major investee companies including Hyundai Mobis,
Hyundai Steel, Dongfeng Yueda Kia Motors Corp. and Kia Motors
Europe GmbH (KME).
Total non-operating profit for the year therefore recorded a
signicant improvement from a loss of KRW 241 billion in 2008 to
a gain of KRW 555 billion in 2009.
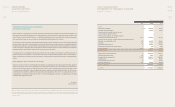
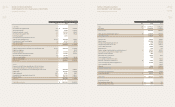
ASSETS
Total assets as of the end of 2009 totaled KRW 16.942 trillion, up
KRW 1.489 trillion, mainly due to increases in cash and equity
method securities. The company’s cash balance, including cash
equivalents and short-term financial instruments, totaled KRW
1.912 trillion, up KRW 895 billion from the previous year, due to
improved cash flows from sales and realization of net income.
Equity method securities posted a gain of KRW 1.017 trillion
to close at KRW 4.93 trillion, buoyed by stronger management
performances of investees such as Hyundai Mobis and Hyundai
Steel.
LIABILITIES
Liabilities totaled KRW 9,565 billion at year-end, down KRW 146
billion from the previous year.
(KRW Billion)
2008 2009 Dierence
Cash & Cash Equivalents 912 1,442 530
Short-term Deposits 105 470 365
Account Receivable 1,001 1,144 143
Inventories 1,028 799 -229
Others 493 453 -39
Current Assets 3,538 4,309 770
PP&E 6,452 6,294 -158
Equity Method Securities 3,913 4,930 1,017
Intangible assets 972 1,074 102
Others 577 335 -242
Non-current Assets 11,914 12,633 719
Total Assets 15,452 16,942 1,489
2008 2009 Dierence
ASP (KRW Million) 14.1 14.8 +4.9%
Domestic (KRW Million) 15.2 16.1 +5.9%
Export (USD Million) 12.4 11.2 -9.6%
Exchange Rate (USD / KRW) 1,125 1,257 +11.7%
2008 2009 Dierence
COGS to Revenue 79.5% 75.1% -4.4%p
SG&A to Revenue 18.7% 18.7% +0.0%p
Revenue 98.2% 93.8% -4.4%p
(thousand units, KRW Billion)
% of Units % of Units
2008 / Revenue 2009 / Revenue Dierence(%)
Sales Units 1,056 1,142 +8.1%
Domestic 315 29.8% 411 36.0% +30.5%
Export 741 70.2% 731 64.0% -1.4%
Revenue 16,382 18,416 +12.4%
Domestic 5,015 30.6% 6,953 37.8% +38.6%
Export 11,367 69.4% 11,463 62.2% +0.8%
Gross Prot 3,364 20.5% 4,591 24.9% +36.5%
Operating Prot 309 1.9% 1,144 6.2% +270.9%
Prot before Income Tax 68 0.4% 1,700 9.2% +2,407.8%
Net Prot 114 0.7% 1,450 7.9% +1,174.6%
(KRW Billion)
2008 2009 Dierence
Net Interest Expense -192 -212 +19
F/X Gain & Loss -308 -72 -236
Equity Gain 548 814 266
Others -288 25 313
Total -241 555 796