JetBlue Airlines 2008 Annual Report Download - page 74
Download and view the complete annual report
Please find page 74 of the 2008 JetBlue Airlines annual report below. You can navigate through the pages in the report by either clicking on the pages listed below, or by using the keyword search tool below to find specific information within the annual report.-
 1
1 -
2
-
3
-
4
-
5
-
6
-
7
-
8
-
9
-
10
-
11
-
12
-
13
-
14
-
15
-
16
-
17
-
18
-
19
-
20
-
21
-
22
-
23
-
24
-
25
-
26
-
27
-
28
-
29
-
30
-
31
-
32
-
33
-
34
-
35
-
36
-
37
-
38
-
39
-
40
-
41
-
42
-
43
-
44
-
45
-
46
-
47
-
48
-
49
-
50
-
51
-
52
-
53
-
54
-
55
-
56
-
57
-
58
-
59
-
60
-
61
-
62
-
63
-
 64
64 -
 65
65 -
 66
66 -
 67
67 -
 68
68 -
 69
69 -
 70
70 -
 71
71 -
 72
72 -
 73
73 -
 74
74 -
 75
75 -
 76
76 -
 77
77 -
 78
78 -
 79
79 -
 80
80 -
 81
81 -
 82
82 -
 83
83 -
 84
84 -
85
-
86
-
87
-
88
-
89
-
90
-
91
-
92
-
93
-
94
-
95
-
96
-
97
-
98
-
99
-
100
-
101
-
102
-
103
-
104
-
105
-
106
-
107
-
108
-
109
-
110
 |
 |

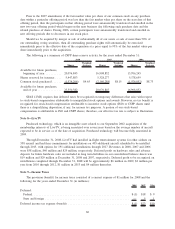
The following is a listing of our assets and liabilities required to be measured at fair value on a recurring
basis and where they are classified within the SFAS 157 fair value hierarchy (as described in Note 1) as of
December 31, 2008 (in millions).
Level 1 Level 2 Level 3 Total
Assets
Cash and cash equivalents ........................... $409 $ — $ — $409
Restricted cash ................................... 140 — — 140
Auction rate securities (ARS) ........................ — — 244 244
Put option related to ARS ........................... — — 14 14
$549 $ — $258 $807
Liabilities
Aircraft fuel derivatives ............................. $ — $128 $ — $128
Interest rate swap ................................. — — 10 10
$ — $128 $ 10 $138
Refer to Note 2 for fair value information related to our outstanding debt obligations as of December 31,
2008. The following table reflects the activity for the major classes of our assets and liabilities measured at
fair value using level 3 inputs (in millions) for the three and twelve months ended December 31, 2008:
Auction Rate
Securities
Put Option
related to ARS
Interest Rate
Swaps Total
Balance as of December 31, 2007 ........... $ — $— $— $ —
Transfers in ........................... 255 — — 255
Total gains or (losses), realized or unrealized . . . — — — —
Included in earnings ................... (67) 14 — (53)
Included in comprehensive income ........ — — (10) (10)
Purchases, issuances and settlements, net ...... 56 — — 56
Balance as of December 31, 2008 ........... $244 $14 $(10) $248
Cash and Cash Equivalents: Our cash and cash equivalents include money market securities that are
considered to be highly liquid and easily tradable. These securities are valued using inputs observable in active
markets for identical securities and are therefore classified as level 1 within our fair value hierarchy.
We maintain cash and cash equivalents with various high quality financial institutions or in short-term
duration high quality debt securities. Investments in highly liquid debt securities are stated at fair value. The
majority of our receivables result from the sale of tickets to individuals, mostly through the use of major credit
cards. These receivables are short-term, generally being settled shortly after the sale. The carrying values of all
other financial instruments approximated their fair values at December 31, 2008 and 2007.
Auction rate securities: ARS are long-term debt securities for which interest rates reset regularly at pre-
determined intervals, typically 28 days, through an auction process. We held ARS, with a total par value of
$311 million and $611 million as of December 31, 2008 and 2007, respectively. Beginning in February 2008,
all of the ARS held by us experienced failed auctions which resulted in our continuing to hold these securities
beyond the initial auction reset periods. With auctions continuing to fail through the end of 2008, we have
classified all of our ARS as long term, since maturities of underlying debt securities range from 20 to
40 years. Although the auctions for the securities have failed, $18 million have been redeemed by their issuers
at par, we have not experienced any defaults and continue to earn and receive interest on all of these
investments at the maximum contractual rate. At December 31, 2007, these securities were valued based on
the markets in which they were trading, a level 1 input, which equaled their par value. The estimated fair
value of these securities at December 31, 2008, however, no longer approximates par value and was estimated
through discounted cash flows, a level 3 input. Our discounted cash flow analysis considered, among other
things, the quality of the underlying collateral, the credit rating of the issuers, an estimate of when these
65